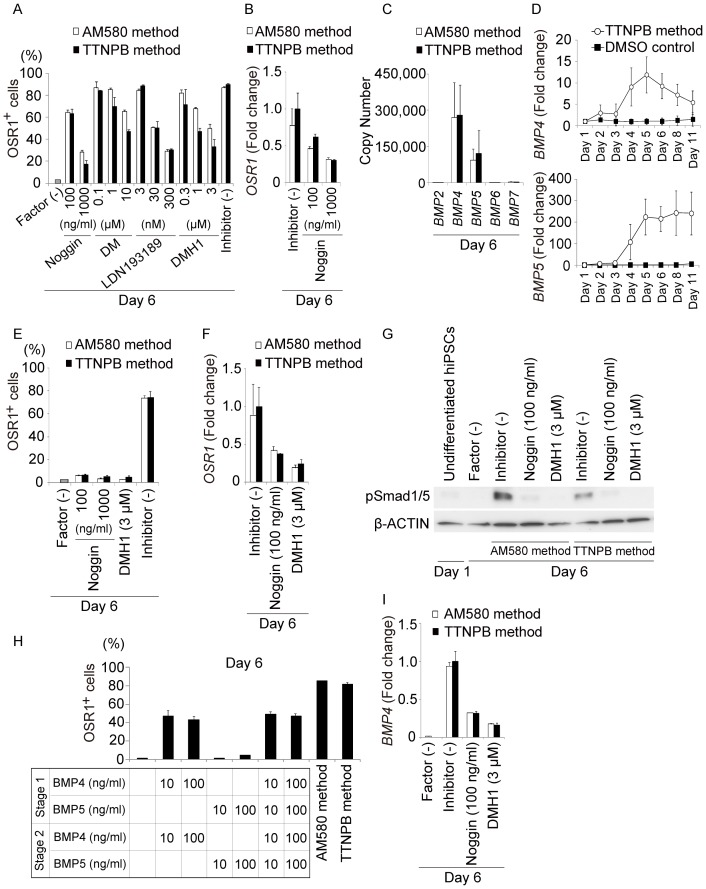
Figure 5. The BMP-Smad Signaling Pathway Regulates Development of IM.
(A) Results of the flow cytometric analyses examining the effects of adding noggin, dorsomorphin (DM), LDN193189 and DMH1 during Stage 2 on the induction of OSR1+ cells on culture day 6 in the AM580 and TTNPB methods. (B) Results of qRT-PCR analyses showing mRNA expression of OSR1 on culture day 6 of the AM580 and TTNPB methods, with or without noggin. (C) Copy numbers of BMP-2, -4, -5, -6, and -7 expressed in differentiation cultures. (D) Time course of BMP-4 and BMP-5 mRNA expression in the TTNPB method. OSR1-GFP knock-in hiPSCs prior to treatments were used to normalize the data. (E and F) Effects of adding noggin or DMH1 during Stages 1 and 2 on the induction of OSR1+ cells and the OSR1 expression levels analyzed on culture day 6. (G) Results of Western blot analyses examining phosphorylation levels of Smad1/5 in differentiation cultures of the small molecule method, with or without noggin or DMH1 added to Stages 1 and 2. (H) OSR1+ cell induction on culture day 6 in the small molecule method and following treatment with various combinations of recombinant BMP-4 and BMP-5 proteins. (I) Results of qRT-PCR analyses showing BMP-4 mRNA expression in differentiation cultures on day 6 of the small molecule method, with or without the addition of noggin or DMH1. Factor (-) indicates the rate of induction of OSR1+ cell (A and E), the phosphorylation level of Smad1/5 (G) and the mRNA expression level of BMP4 (I), on day 6 of the differentiation culture without growth factors or small molecules. OSR1-GFP knock-in hiPSCs obtained on day 6 following treatment of the TTNPB method without inhibitors were used to normalize the data shown in (B), (F) and (I). The data in (A–F, H, I) are means±SD of three independent experiments (n = 3). The data in (G) are representative of three independent experiments.

