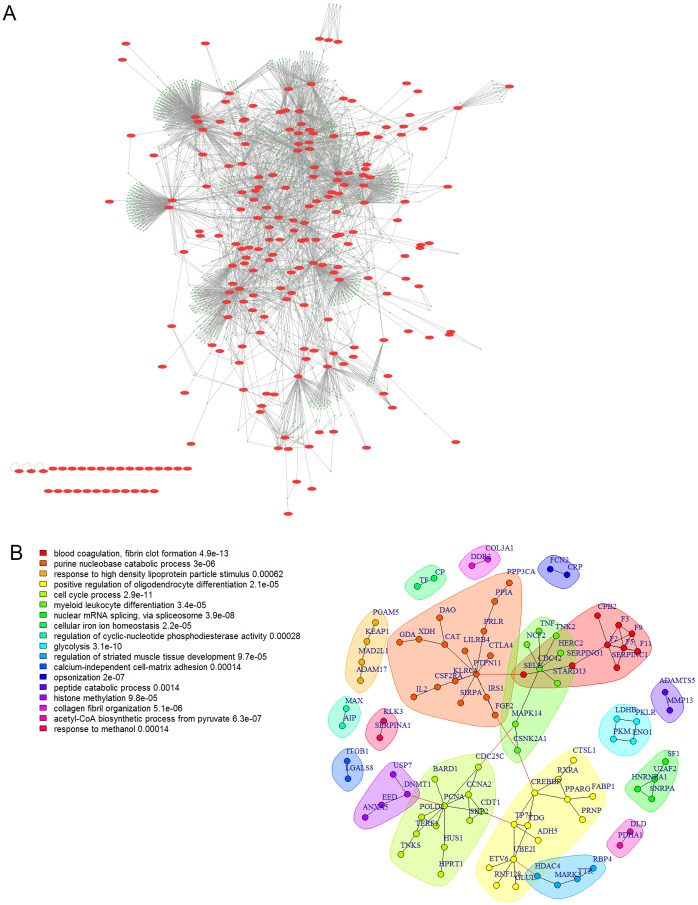
Figure 4. Protein-protein interaction network of genes containing mutations predicted as drivers by InCa only.
A) 1-hop network for the proteins containing mutations predicted as drivers in InCa only. The original proteins are shown as red ellipses. Connecting proteins are shown as green circles. 29 of 215 proteins are in a giant component. B) Induced network of connections between original proteins only excluding orphans. The network contains 94 proteins and optimal communities are colour coded. The legend show the top enriched GO BP term in each community.

