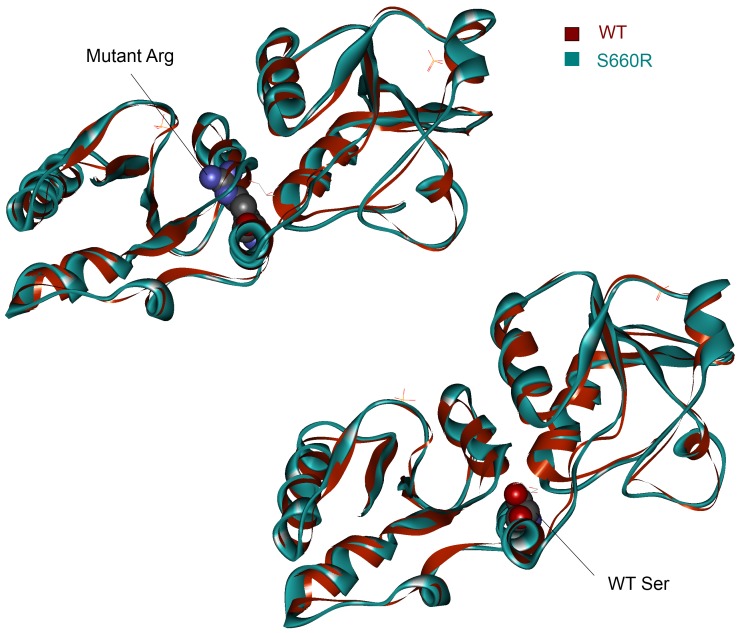
Figure 5. Energy minimisation of the S660R mutation in BARD1.
The top panel shows the mutant Arg residue in the mutant structure causing a steric clash with the helix opposite. The wild-type (WT) structure is shown in red overlaid with the mutatnt structure in blue. The bottom panel shows the WT Ser residue.

