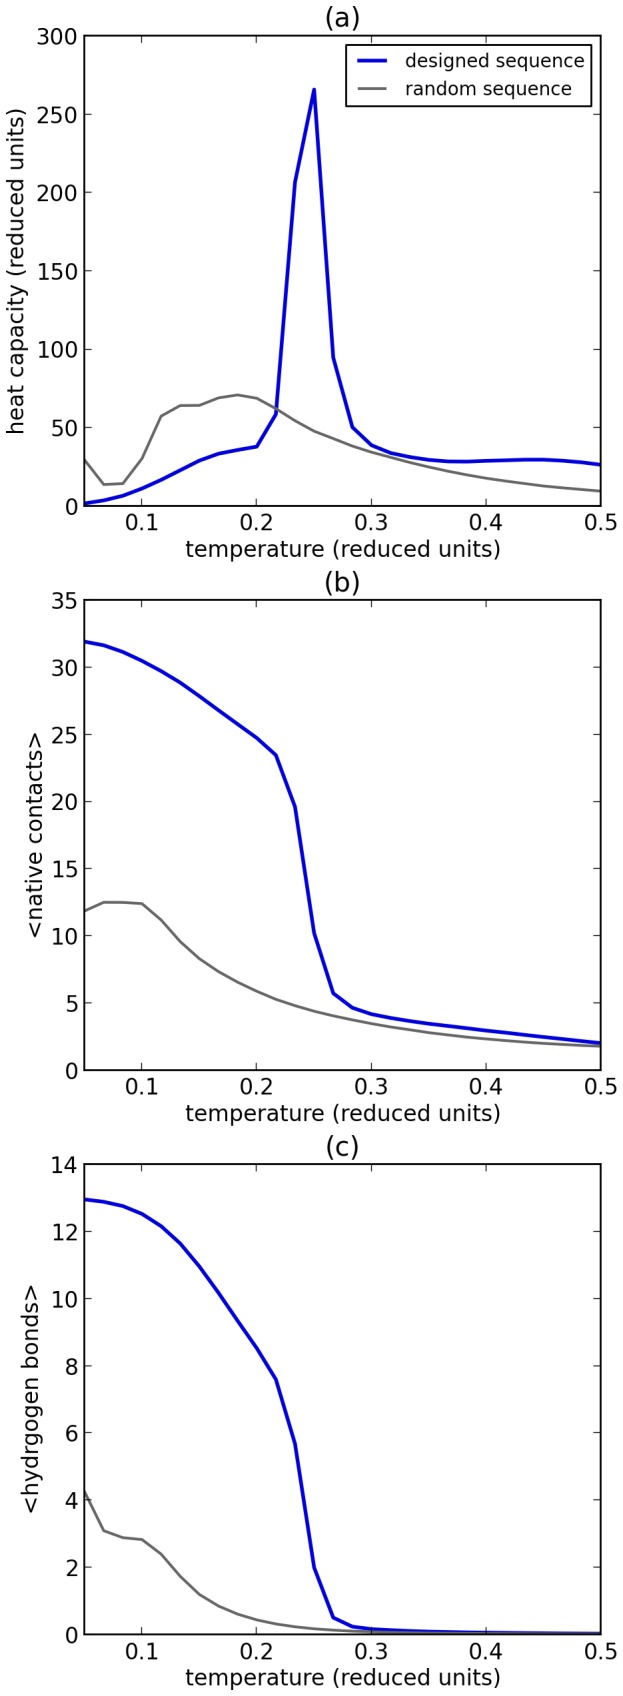
Figure 2. Folding chacteristics and specificity.

Folding characteristics are shown for a protein sequence that is designed to fold in a specific structure, and a random protein sequence; both sequences contain 35 residues and have a similar amino acid composition (see Methods). (a) Heat capacity versus temperature. A peak in the heat capacity curve can be observed at the folding transition. (b) Number of native contacts versus temperature. (c) Number of hydrogen bonds versus temperature. From the statistics it is clear that the sequence designed to fold shows a much sharper transitions than a random sequence of the same length. Moreover, the number of hydrogen bonds formed is strongly dependent on the sequence. Please refer to the Methods and Supplement for the sequences and structures used.
