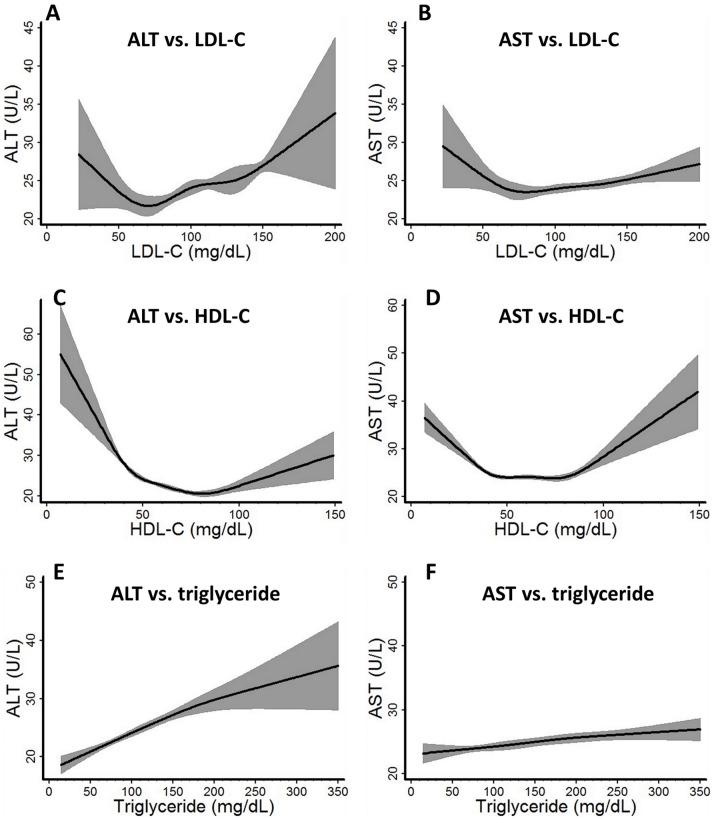
Figure 2. Association curves between ALT, AST and LDL-C, HDL-C and triglyceride.
The relationship between ALT, AST and LDL-C, HDL-C and triglycerides were modeled with unadjusted restricted cubic spline models. Evenly distributed conventional lipid profile cutoff points were chosen as knots in generating the model, with LDL-C at 40, 70, 100, 130, 160 mg/dL; HDL-C at 20, 30, 40, 60, 80, 100 mg/dL, and triglyceride at 50, 100, 150, 200, 250 mg/dL. Sample weights were taken into consideration during the modeling to represent the association in the general US population.

