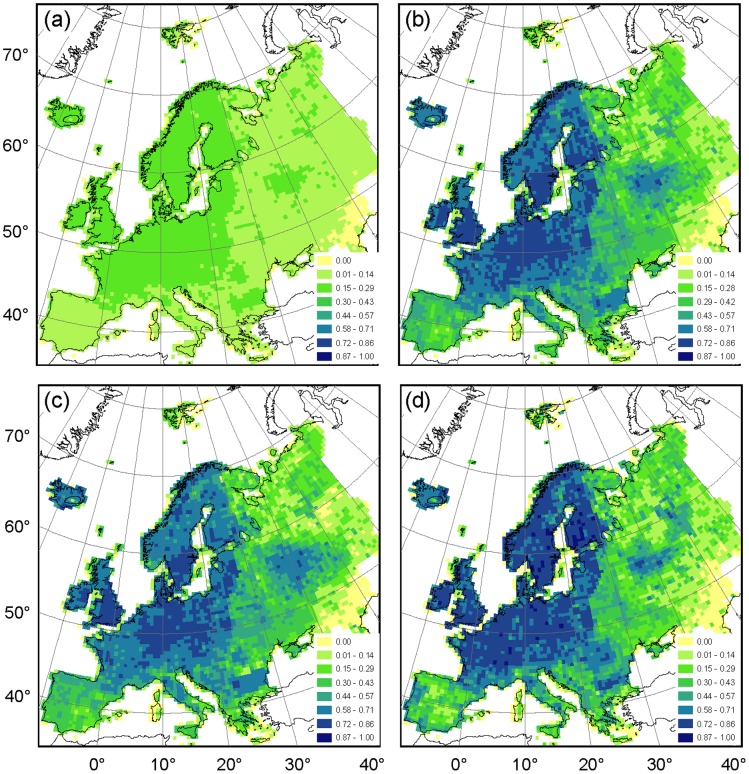
Figure 5. Jaccard similarity index and the maximum index value per cell (Jmax) between (a) the two complete atlases (Jmax = 0.29), (b) the intersection of species occurring in both atlases (Jmax = 0.84), (c) the independent data subset of species mapped in both atlases (Jmax = 0.84) and (d) the dependent data subset of species (bottom-right panel, Jmax = 1.00).
In each of the panels the Jaccard similarity index is illustrated using a seven-category scale legend, where a light grey tone indicates low species list similarity and dark grey tone high species list similarity. Cells with a species similarity index of null were left empty.

