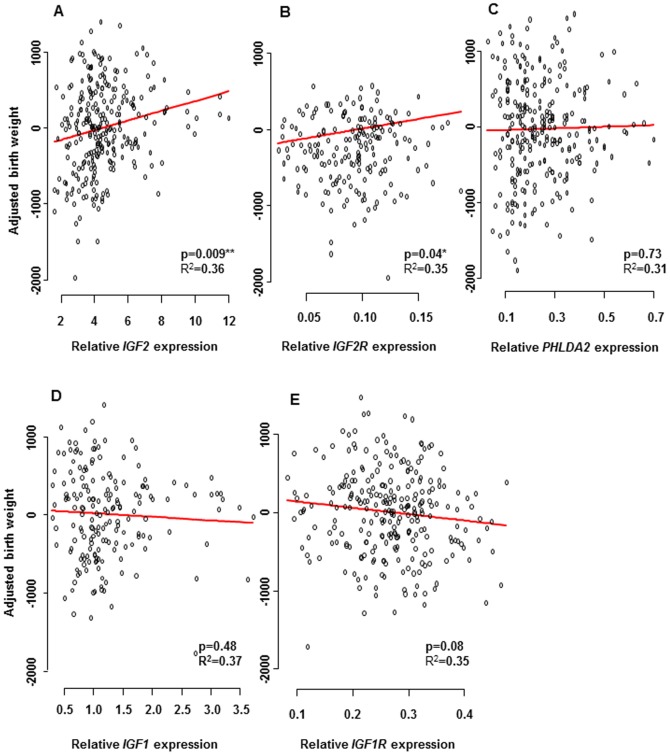
Figure 1. mRNA expression levels of IGF2, IGF2R, PHLDA2, IGF1 and IGF1R in chorionic villi.
The expression levels of IGF2, IGF2R, PHLDA2, IGF1 and IGF1R after standardization to the endogenous control gene L19, in relation to birth weight corrected for parity, sex, GA at term, maternal BMI and smoking status. Significant associations were observed for CVS expression of A) IGF2 (p = 0.009) and B) IGF2R (p = 0.04). No significant association was found for C) PHLDA2 (p = 0.73), for D) IGF1 (p = 0.48) or for E) IGF1R (p = 0.08).

