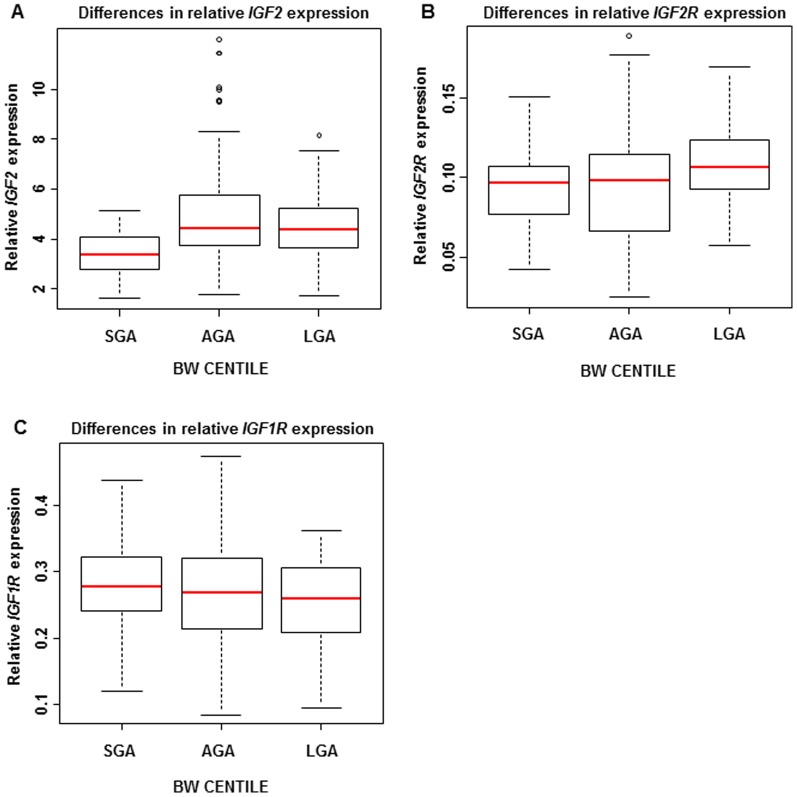
Figure 3. mRNA expression levels of IGF2, IGF2R, and IGF1R in chorionic villi according to BW centile.
Relative IGF2, IGF2R, and IGF1R expression levels in the pregnancies with small (SGA), appropriate (AGA) and large (LGA) neonates. In the SGA group, compared to the AGA group, A) IGF2 expression was lower (p = 3·6×10−7), but there was no significant difference in the expression levels of B) IGF2R (p = 0·76) or C) IGF1R (p = 0·15). In the LGA group B) IGF2R expression was higher than in the AGA group (p = 0·02) and C) IGF1R expression was lower than in the SGA group (p = 0·05).

