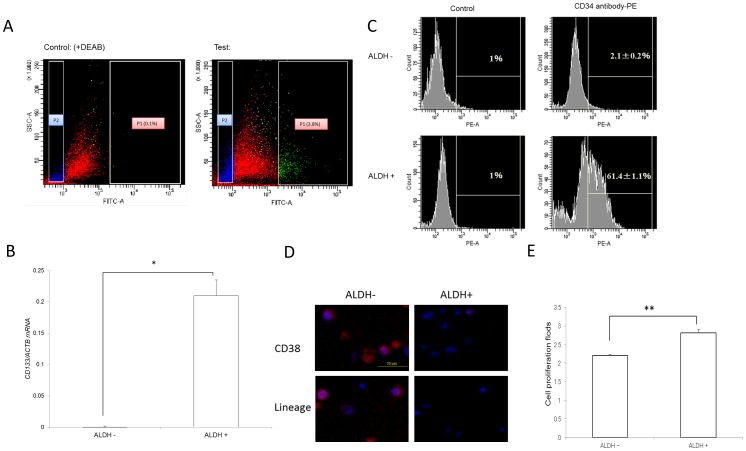
Figure 2. ALDH+ K562-KOr cells showed LSC properties.
(A) FACS analysis for ALDH+ cells (P1 and P2 indicate the ALDH+ and ALDH- subpopulations, respectively). (B) qPCR for the CSC marker CD133 in ALDH+ cells (C) CD34-positive cells in the ALDH+ cell population (n = 3), *P<0.05. (D) The negative of CD38 and Lin in ALDH+ cells determined by immunofluorescent staining. Blue, nucleus; red, CD38 or Lin. Scale bar: 20 µm. (E) Cell proliferation at 72 h differed in ALDH- and ALDH+ cells (n = 3), **P<0.01.

