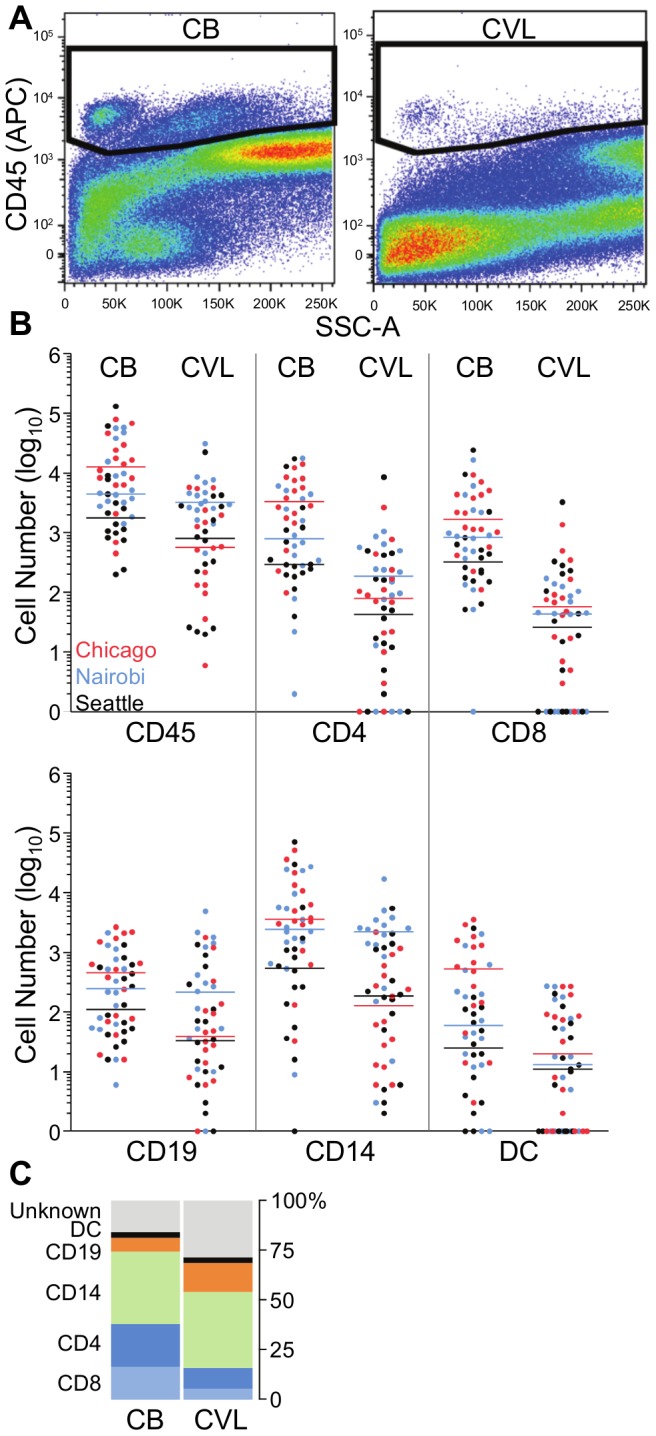
Figure 1. Comparison of immune cell yield and distribution in endocervical cytobrush (CB) and cervicovaginal lavage (CVL) samples.

(A) Representative gates for identification of CD45+ leukocytes from cytobrush and CVL samples. (B) Numbers of CD45+ leukocytes, CD4+ T cells, CD8+ T cells, CD19+ B cells, CD14+ macrophages, and CD19neg/HLA-DQ+ DC enumerated from cytobrush and CVL samples. Cell numbers were log10 transformed, and plotted per site (Chicago, red dots; Nairobi, blue dots; Seattle, black dots). Horizontal bars indicate median values for each site. (C) Percentage contribution of each cell subset, as well as of cells that do not fit one of the described populations (“unknown”), to the total CD45+ population from cytobrush and CVL samples. Data are averaged across sites. P values are listed in the text, and median and IQR in Table 1.
