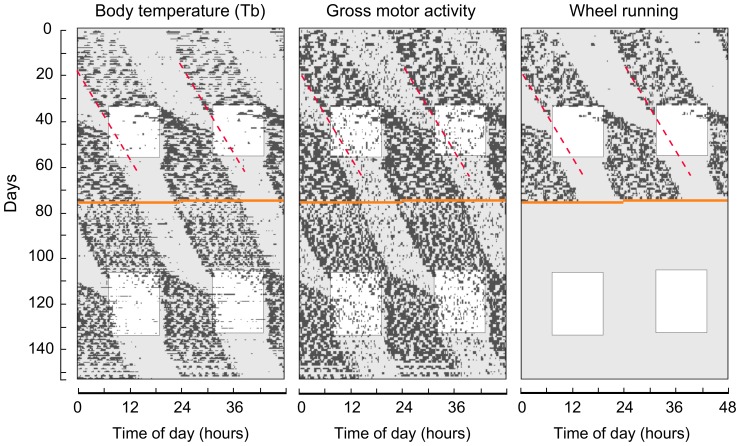
Figure 1. Free-running and synchronized rhythms, with and without running-wheels.
Double-plotted actograms of Tb, gross motor activity and wheel running of a representative individual (#69). Black bars indicate the moments in which Tb rose above 36.2°C (left), gross motor activity rose above 50 counts (middle) and in which wheel running revolutions were detected (right). Gray and white backgrounds represent darkness and light hours, respectively. Orange line indicates the day in which the running wheel was removed. Red dashed lines indicate the onset of the free-running rhythms in the first DD exposure. Rhythms then synchronize to the LD cycle and upon reestablishment of DD, the phase of the onset is determined by the previously synchronized rhythm, not the one projected by the red line. This is indicative of entrainment of the circadian oscillator by the LD cycle, as opposed to masking of the output rhythms.

