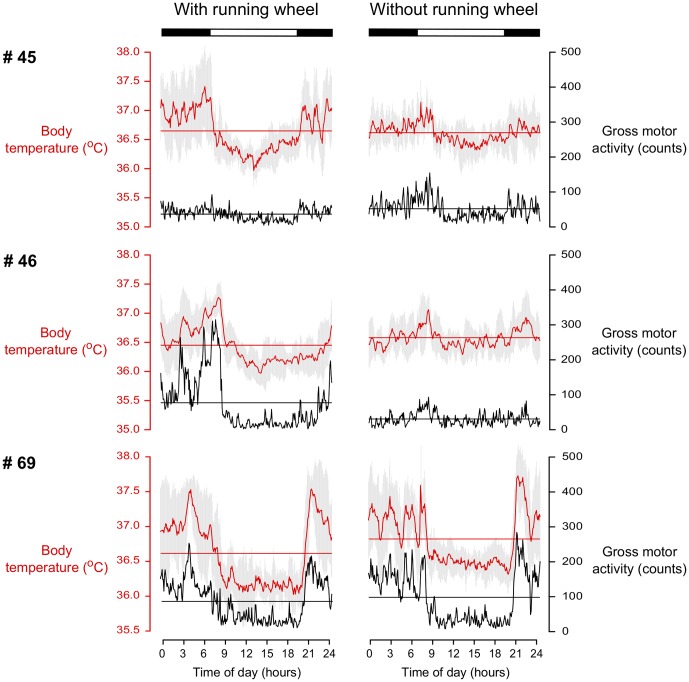
Figure 2. Temporal relationship between Tb and motor activity rhythms.
Waveforms of Tb (red) and gross motor activity (black) rhythms of three individuals under LD 12∶12 (lights on at 07:00 am), with (left) and without (right) running-wheels. Each point represents the average of 10-day measures for the corresponding time of the day. Horizontal lines indicate the mean of the total values obtained for each variable and vertical gray line represent the standard deviation for Tb for each time over the 10 days.

