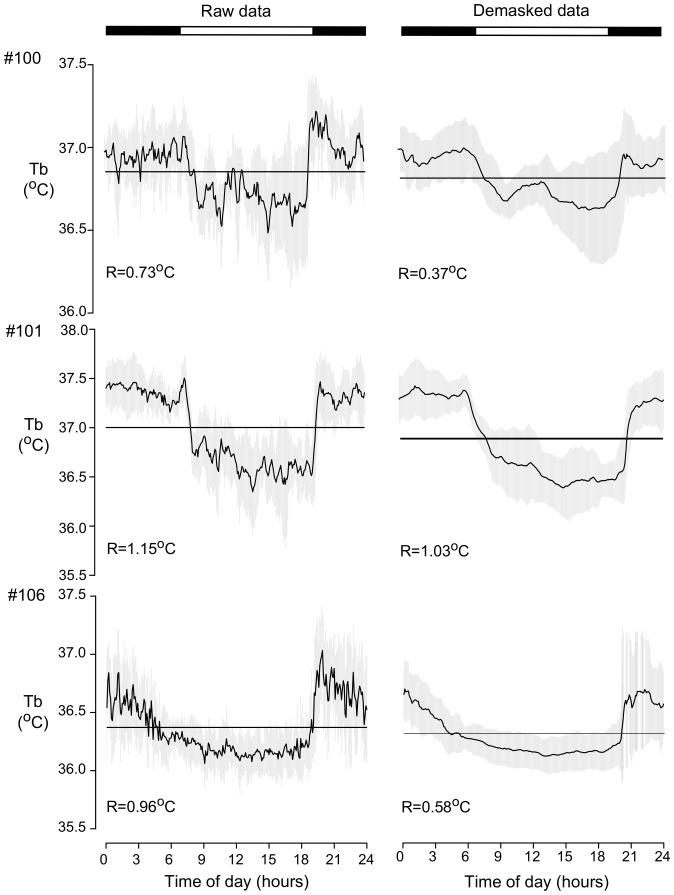
Figure 4. Comparison of the daily Tb rhythm before and after the demasking treatment.
Waveforms of raw (left) and demasked (right) data from three animals with access to a running wheel under LD 12∶12 cycle. Each point represents the average of 8-day measures for the corresponding time of the day. Horizontal lines indicate the mean of the total values obtained for raw and demasked Tb and vertical gray line represent the standard deviation for Tb for each time over the 8 days. Above each waveform are the range of oscillation values. The numbers on the left are the codes for each animal.

