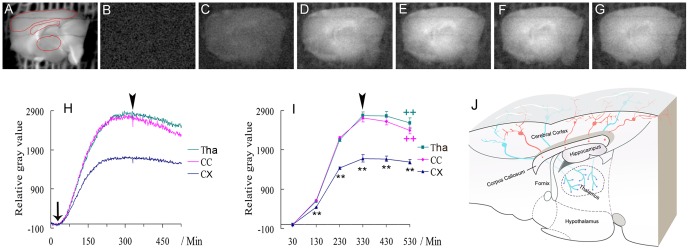
Figure 4. Imaging biophotonic activities and transmission in mouse sagittal brain slices.

(A) A representative regular image of sagittal brain slices and the regions of interest (ROIs), including the cerebral cortex, corpus callosum and thalamus, are marked by red lines, which were selected for the analysis of biophotonic activities. (B–I) Representative biophoton gray images at the selected time periods before (B–E) and after (F, G) the application of Protein Phosphatase 2 inhibitor (OA). Each image was obtained from the merger of 100 continuously processed original grey images. The sum of the time course of the average change of RGVs (H, 1 min imaging time for each time point) and the sum of time course of average change of RGVs from the 100 continuously processed original gray images (I) in the cerebral cortex, corpus callosum and thalamus before and after the application of OA (n = 7 slices from the same number of mice). The significant increase of biophotonic activities in the corpus callosum and the thalamus (C–E, H, I) tended to decay after the application of OA (F–I). Arrow and arrowheads in H and I indicate the time points for the long-lasting application of 50 mM glutamate and 200 nM OA, respectively. Data show mean±s.e.m. CX: cerebral cortex; CC: corpus callosum; Tha: thalamus. * CC or Tha group (corresponding color) versus CX group at the same time periods; + the effects after application of OA versus the maximum effect (arrowhead) before in each group. * or + P<0.05, ** or ++ P<0.01. (J) A schematic explanation for the origin of biophotonic activities in the corpus callosum and thalamus in a sagittal brain slice. The cut end of axons in the corpus callosum (red spots) and the cut end of axonal terminals in the thalamus (blue spots) originate from the cortical projection neurons (red and green, respectively). Such anatomic projection patterns of cortical projection neurons indicate that the detected biophotonic activities in the corpus callosum and thalamus originate from the cortical projection neurons via the biophotonic transmission along their axons or axonal terminals.
