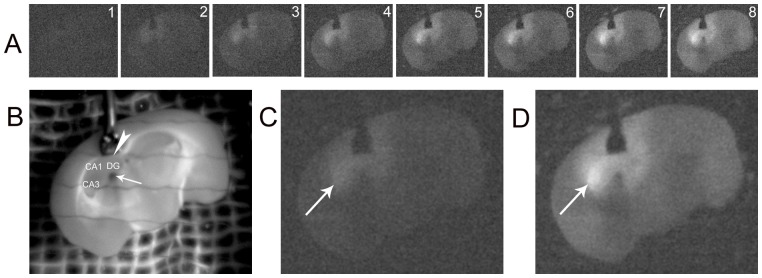
Figure 5. Biophotonic activities and transmission in intrahippocampal circuits.

(A) The spatiotemporal change of biophotonic activities in a coronal brain slice at the selected time periods (digit:1–8) after the local application of 75 mM glutamate to hippocampal dentate gyrus (DG) together with whole slice perfusion with 25 mM glutamate. Each image was obtained from the merger of 25 continuously processed original gray images (1 min imaging time for each original image). (B) A regular image of this coronal brain slice showing the local perfusion of the hippocampal DG at the rostral part of the hippocampus. Arrow and arrowhead indicate the input and output perfusion sites, respectively, and DG, CA2 and CA1 areas in the hippocampal formation are shown. (C, D) Two enlarged biophoton gray images obtained from the merger of 100 continuously processed original gray images at the selected time periods (images A 1–4 for A and A 5–8 for D), showing an increase of biophotonic activities in the ipsilateral CA3 (arrow in C or D), indicating biophotonic activity transmission from DG to CA3. Such an observation was repeated in 5 slices from the same number of mice.
