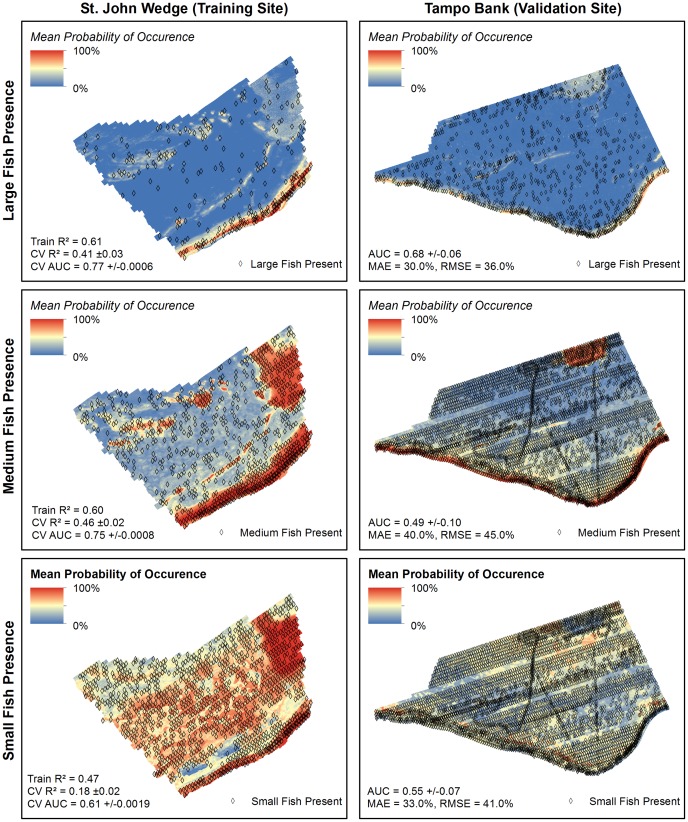
Figure 6. Fish occurrence spatial predictions.
Three spatial predictions denoting the probability of occurrence for large, medium and small fish were created for both the training and validation sites. The spatial outputs from 10 different BRT models were averaged to create the spatial predictions seen here. Metrics describing the performance and accuracy of these models and spatial predictions are located in the lower left corner of each map.

