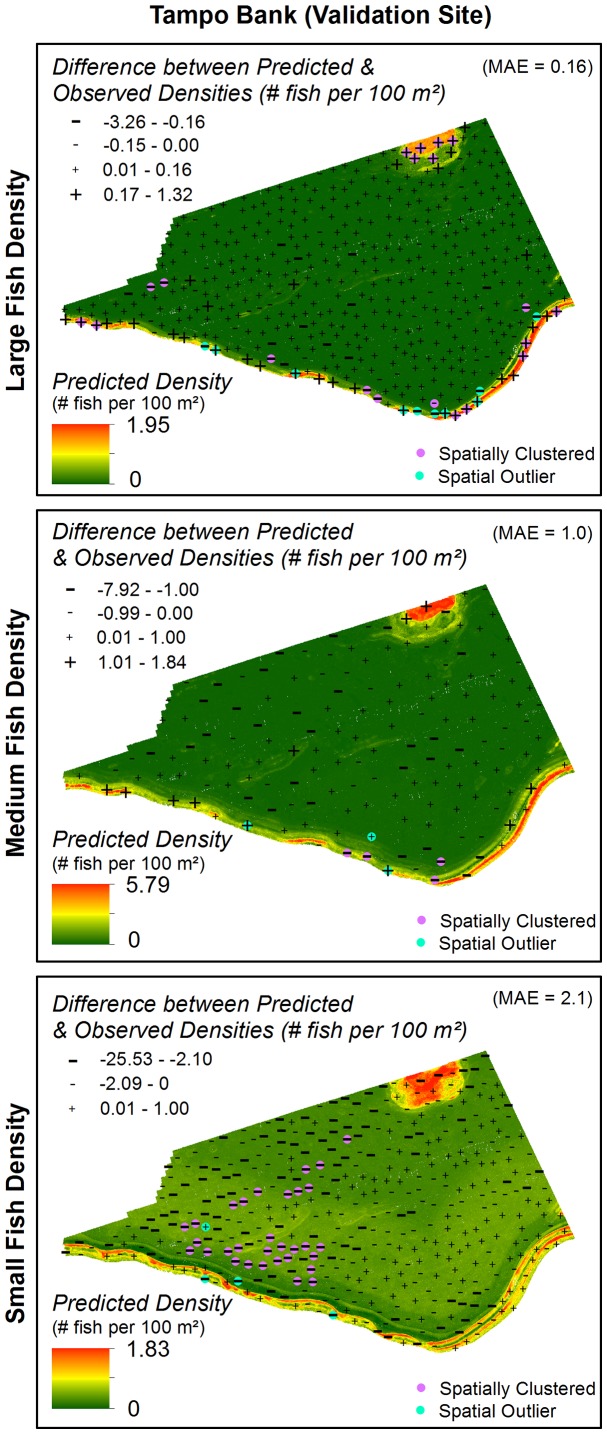
Figure 10. Errors for fish density spatial predictions.
The magnitude and spatial structure of the errors for the fish density predictions were calculated by subtracting the predicted from the observed fish density values. Negative values indicate that the model under-predicted, and positive values indicate the model over-predicted the density of large, medium and small fish. The error data was divided into classes based on the MAE. Spatial autocorrelation of the residuals were analyzed using Anselin Local Moran's I statistic. Analyzing the spatial location and arrangement of errors can be important because they may offer clues about missing ecological or biological variables and their spatial structure.

