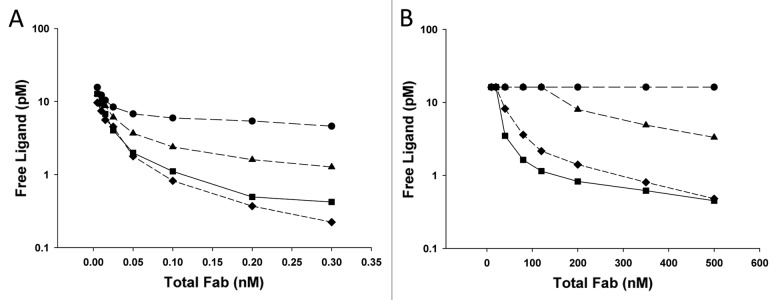
Figure 2. Free ligand levels as measured in the assay over a range of on-plate incubation times for (A) the low concentration Fab/ligand samples and (B) the high concentration Fab/ligand samples listed in Table 2. Samples were pre-incubated for 24 h prior to addition to plate. Samples were incubated on the plate for 10 min (squares), 1 h (diamonds), 6 h (triangles) or 24 h (circles). Samples above the quantitation limit of the assay are plotted at the quantitation limit for visualization purposes.
