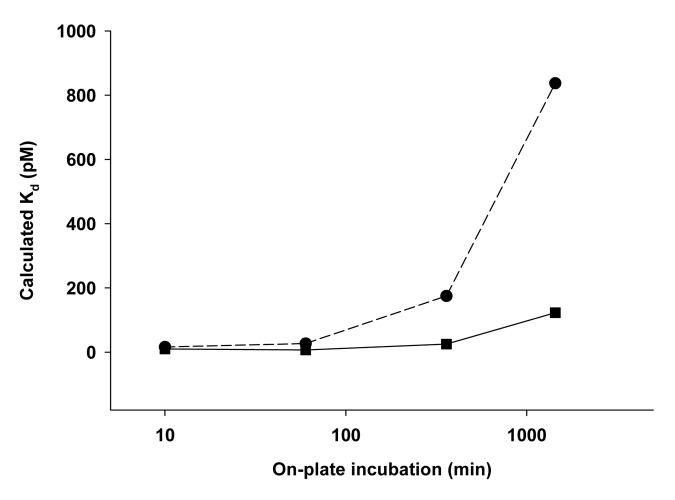
Figure 3. Kd values as a function of on-plate incubation time, obtained from fitting Equation 1 to the data in Figure 2 for the low concentration Fab/ligand samples (squares) and the high concentration Fab/ligand samples (circles). Higher Kd values suggest potential exchange from ligand bound to Fab in solution to the anti-ligand antibody on the plate, leading to an overestimation of the free ligand.

An official website of the United States government
Here's how you know
Official websites use .gov
A
.gov website belongs to an official
government organization in the United States.
Secure .gov websites use HTTPS
A lock (
) or https:// means you've safely
connected to the .gov website. Share sensitive
information only on official, secure websites.
