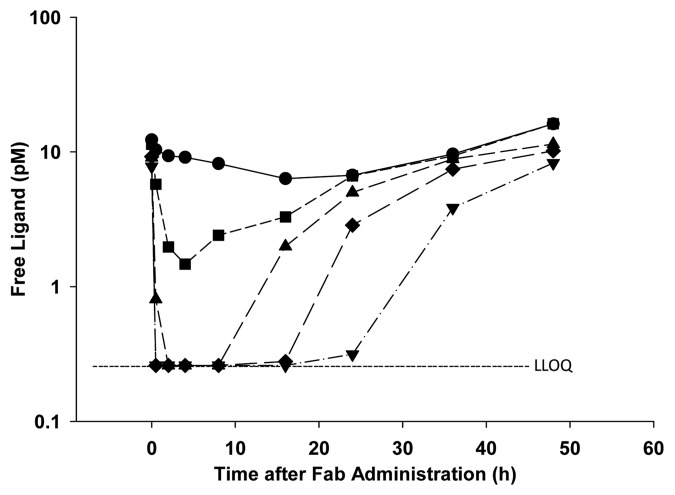
Figure 7. Free ligand concentration-time profiles following subcutaneous administration of anti-ligand Fab to Sprague-Dawley rats at doses of 0 (circles), 0.03 (squares), 0.1 (triangles), 0.3 (diamonds) or 1 (inverted triangles) mg/kg. Samples were pooled across a group of 6 rats at each time point prior to analysis. Samples below the lower limit of quantitation (LLOQ) are plotted at the limit of quantitation for visualization purposes.

An official website of the United States government
Here's how you know
Official websites use .gov
A
.gov website belongs to an official
government organization in the United States.
Secure .gov websites use HTTPS
A lock (
) or https:// means you've safely
connected to the .gov website. Share sensitive
information only on official, secure websites.
