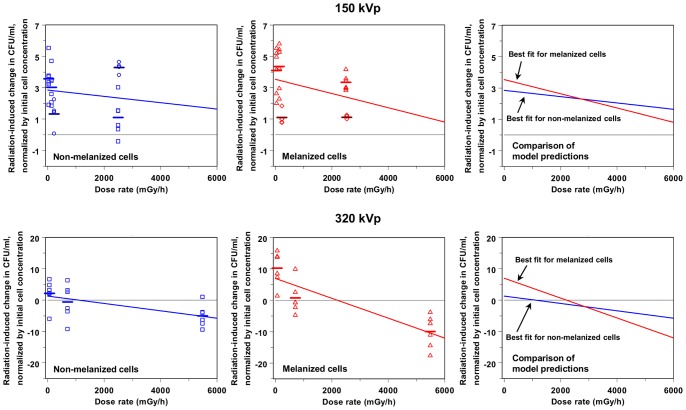
Figure 3. Analysis of the proliferation of C. neoformans continuously X-irradiated for 24 hours.
The symbols represent radiation-induced change (Qe) in CFU/ml (normalized by the initial cell concentration) measured for melanized and non-melanized cells at each combination of X-ray peak energy (150 or 320 kVp) and dose rate. Different symbol colors, shapes, and bar colors represent different experiments. Horizontal bars indicate mean values from each experiment. The lines are best-fit predictions generated by the proposed model, Q = A(e, t, m) – [B(e, t, m) x R], which predicts the radiation effect on proliferation relative to background conditions (Q, shown on the y-axis), based on radiation dose rate (R shown on the x-axis), X-ray peak energy (e), duration of irradiation (t), and cell melanization status (m). Model parameter A represents radiation-induced growth enhancement at low dose rates, and parameter B represents radiation-induced growth inhibition, proportional to dose rate.

