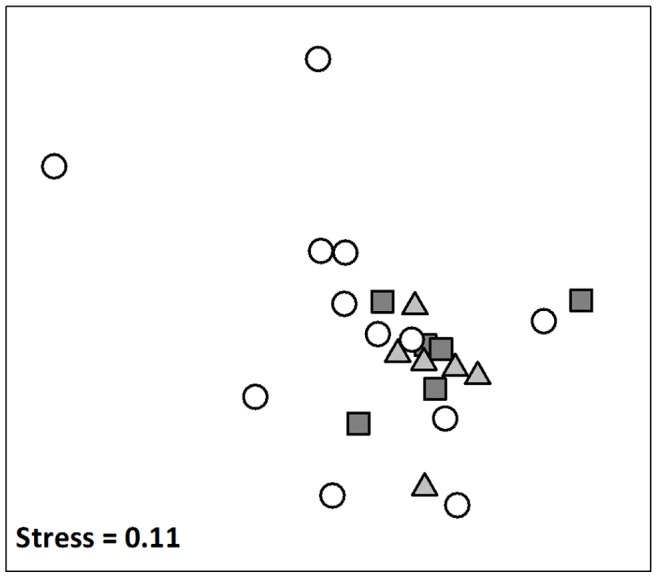
Figure 2. nMDS ordination of fish assemblages represented as centroids for each site within sanctuary (white circles), habitat protection (light grey triangles) and general use (dark grey squares) zones since the commencement of the zoning plan for the Batemans Marine Park.

As there were no significant interactions between years and main effect contrasts (Table 1), points indicate site centroids averaged across years since establishment.
