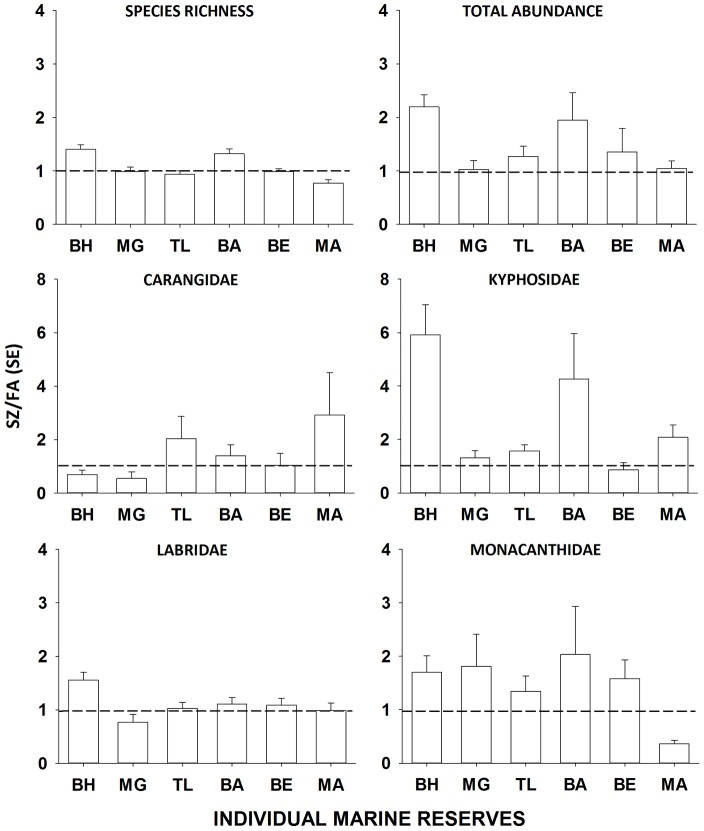
Figure 5. Mean (±1 SE) sanctuary zone to local fished areas ratio (SZ/FA) for richness and total max N of fish assemblages and numerically-dominant family groups in the Brush Island (BH), Murramarang (MG), Tollgate Islands (TL), Burrewarra (BA), Broulee Island (BE) and Mullimburra (MA) sanctuary zones.
Bars represent the main effects of sanctuary zone averaged across years since establishment.

