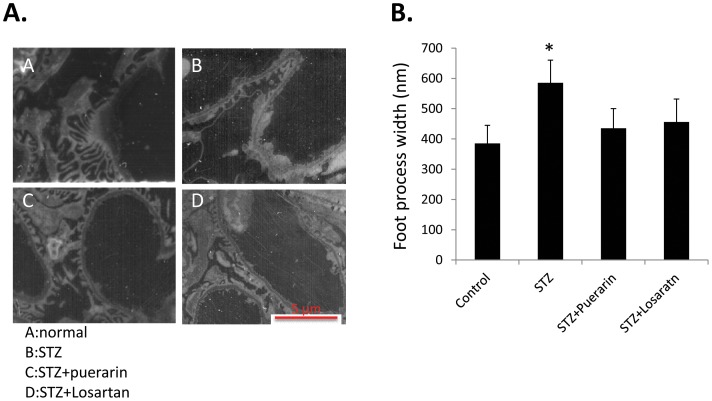
Figure 4. Kidney electron microscopy.
A. Kidney samples from the four experimental groups were examined under transmission electron microscope as indicated. Panel A is for normal rats; panel B is for STZ rats, panel C is for STZ+puerarin rats and panel D is for STZ+losartan rats. Magnification 1,800×. B. Quantification of podocyte effacement is shown (n = 5, *p<0.001 STZ rats versus all other groups).

