
Figure 6. Influence of hfq on bacterial survival to acidic and oxidative stress.
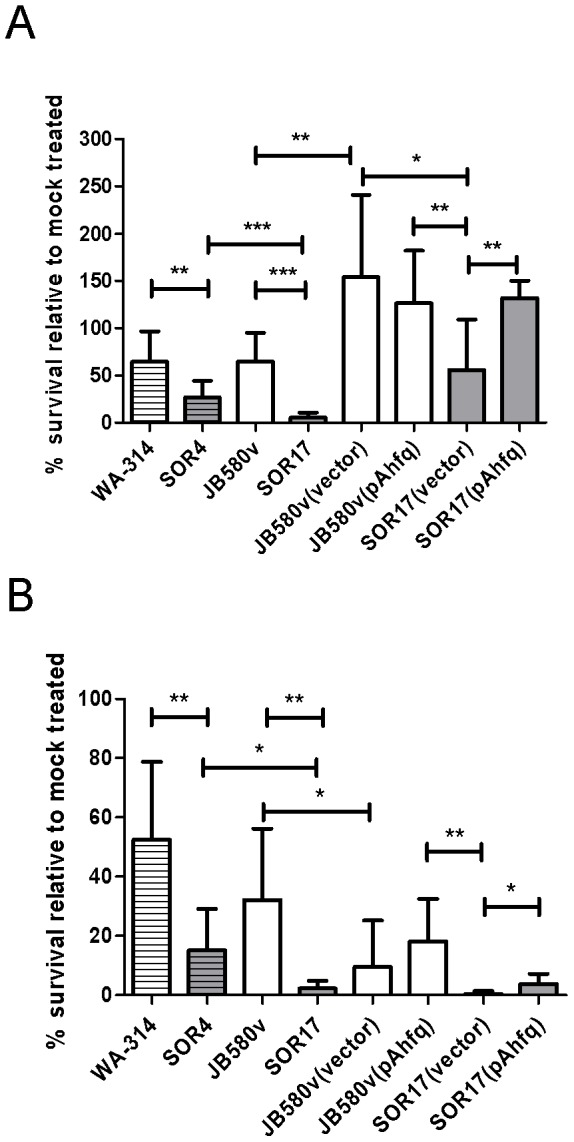
(A) Bacterial survival to exposure to pH 4.0 for 90 min. (B) Bacterial survival to exposure to 1 mM H2O2 for 90 min. Results are expressed as % survival relative to bacteria incubated in PBS pH 7.5 and are the mean and standard deviation of at least three experiments performed with three separate cultures. Complementation assays correspond to two independent experiments performed with at least three separate cultures. Significance was calculated with Student‘s unpaired t-test (*P<0.05; **P<0.01; ***P<0.001). Bacterial strains are WA-314 and its hfq-negative derivative SOR4, JB580v and its hfq-negative derivative SOR17.