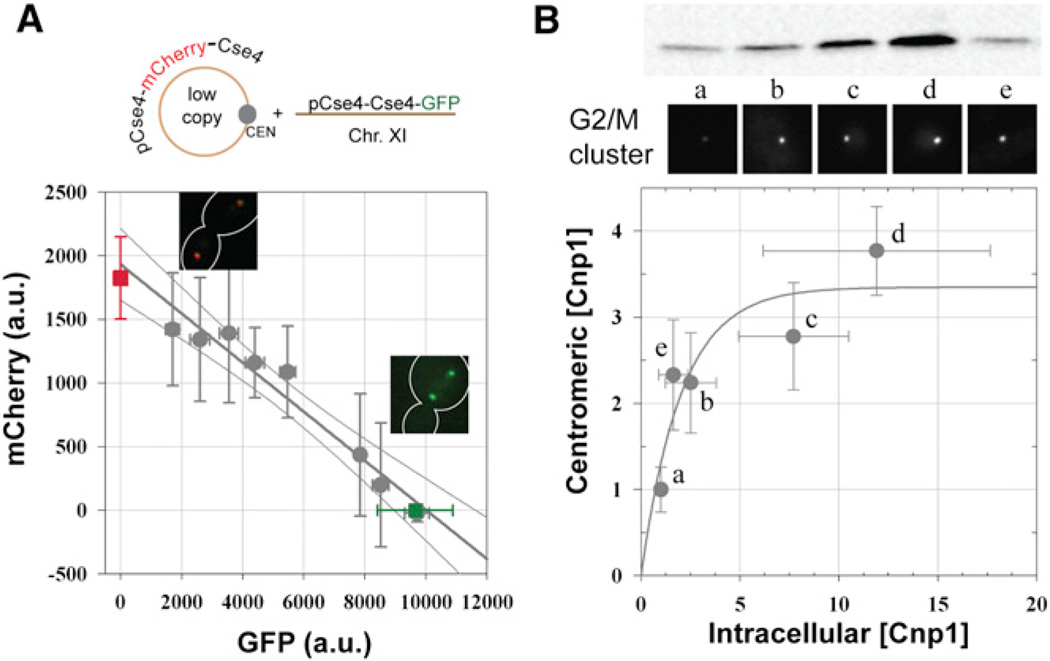
Figure 4. Dependence of CENP-A Recruited at Point and Regional Centromere on Intracellular CENP-A Concentration.
(A) Relative levels of mCherry-Cse4 and Cse4-GFP recruited in anaphase centromere clusters in a strain expressing chromosomal Cse4-GFP and ectopic mCherry-Cse4 (top panel). Linear regression of the data (n = 79, binned based on the GFP signal) shows inverse correlation between the amount of the two Cse4 species (gray line, R2 = 0.96; data represent mean ± SD). The regression also predicts the signals measured in strains expressing only Cse4-GFP (green square) or Cse4-mCherry (red square, 95% confidence intervals represented by gray curves).
(B) Dependence of Cnp1-GFP recruited at the centromere in G2/M cells on its intracellular concentration. Relative intracellular protein concentration was quantified using western blot analysis (top inset) and normalized relative to the lowest expressing strain. Synchronized culture was not used, because the majority of fission cells in an asynchronous culture are in G2/M due to the long duration of this cell-cycle phase. The centromeric Cnp1-GFP in G2/M cells was quantified using previously described methods from the strains (representative images show clusters of six centromeres in G2/M cells) and normalized to the strain with the lowest centromeric signal (strain key: a: YWY277, b: AJY687, c: AJY686, d: AJY688, e: JW3523). Gray curve displays fit to the data with a single exponential rising to the maximum value (n = 4 for western blots, n > 30 for fluorescence measurements, error bars represent SD. R2 = 0.93).

