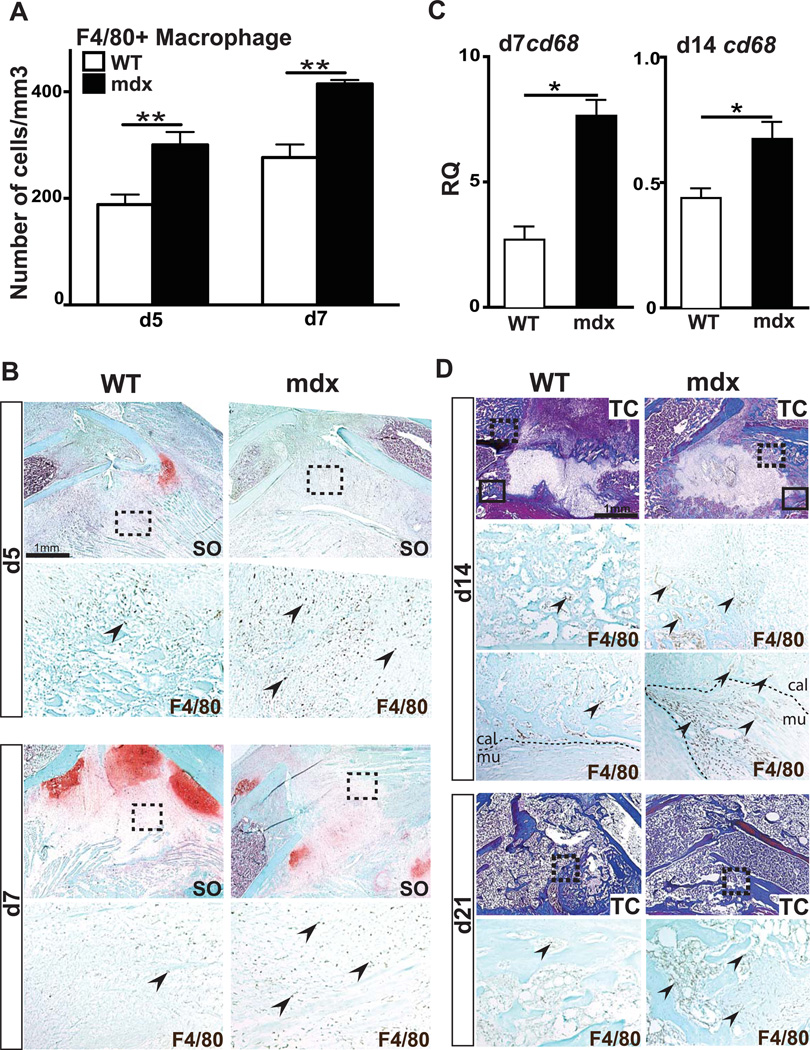
Figure 4. Effects of muscular dystrophy on macrophage recruitment during fracture repair.
(A) Stereological quantification of F4/80+ cells within wild type (WT) and mdx calluses after 5 (d5) and 7 days (d7) of bone regeneration. (B) Safranin-O (SO) staining and representative F4/80 staining (arrows, area corresponds to dashed box in SO) on adjacent sections of WT and mdx calluses at day 5 (d5) and day 7 (d7) of bone regeneration. (C) Relative quantification (RQ) by RTqPCR of cd68 mRNA, marker of macrophages, at days 7 (d7) and 14 (d14) within WT and mdx calluses. Expression level was normalized to GAPDH mRNA. (D) Trichrome (TC) staining and representative F4/80 staining (arrows, area corresponds to dashed box in TC staining) on adjacent sections of WT and mdx fracture calluses at day 14 (d14) and day 28 (d28) of bone regeneration. By d14, there is an increase in F4/80+ macrophages at the interface between callus (cal) and muscle (mu) (arrows, area corresponds to black box in TC staining). Error bars represent ±SEM. Unpaired student’s t test, P values *p<0.05, **p<0.001 (n=5 or 6 per group for F4/80 immunohistochemical staining, n=3 per group for gene expression). Scale bar: 1 mm, 100 µ (B).

