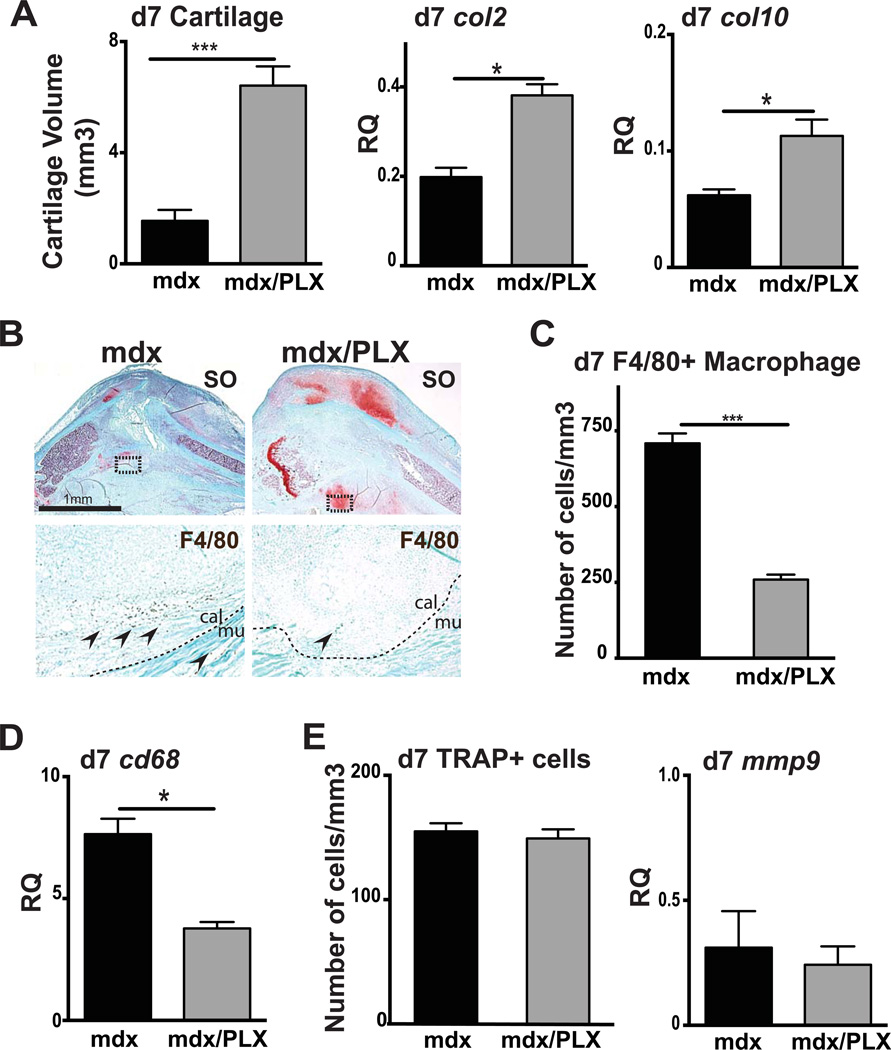
Figure 6. Effects of PLX3397 treatment, a cFMs inhibitor, on fracture healing.
(A) Histomorphometric measurements of total cartilage volume at 7 days (d7) post-injury in mdx mice (mdx) and PLX3397-treated mdx mice (mdx/PLX) (left). Relative quantification (RQ) by RTqPCR of collagen 2 (col2) (center) and collagen 10 (col10) (right) mRNA within mdx and PLX3397-treated mdx calluses at day 7 (d7) post-fracture. Expression level was normalized to GAPDH mRNA. (B) Safranin-O (SO) staining and representative F4/80 staining (arrows, area corresponds to dashed box in SO staining) on adjacent sections of control mdx and PLX3397-treated mdx fracture callus (mdx/PLX) at day 7 (d7) post-injury. (C) Stereological quantification of F4/80+ cells within mdx and PLX3397-treated mdx calluses (mdx/PLX) after 7 days (d7) of bone regeneration. (D) Relative quantification (RQ) by RTqPCR of cd68 mRNA, marker of macrophages, within mdx and PLX3397-treated mdx calluses (mdx/PLX) at day 7 (d7). Expression level was normalized to GAPDH mRNA. (E) Stereological quantification of TRAP+ cells within mdx and PLX3397-treated mdx calluses (mdx/PLX) after 7 days (d7) of bone regeneration (left). Relative quantification (RQ) by RTqPCR of matrix metallopeptidase-9 (mmp9) mRNA (right), marker of osteoclasts, within mdx and PLX3397-treated mdx calluses (mdx/PLX) at day 7 (d7). Expression level was normalized to GAPDH mRNA. Error bars represent ±SEM. Unpaired Student’s t test, P values *p<0.05, ***p<0.0005 (n=5 or 6 per group, n=3 per group for gene expression). Scale bar: 1 mm, 100 µ (B).

