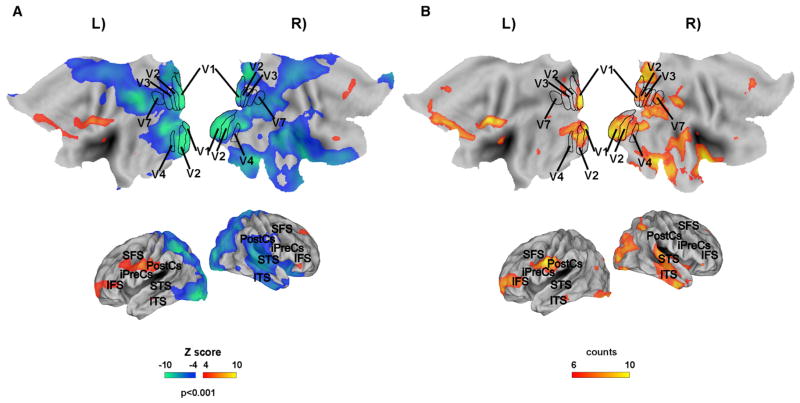
Figure 3. Topographic Changes of Stationary MEG Connectivity in the α BLP Induced by Movie Watching, in the Visual Network.
(A) Voxel-wise map showing the difference between movie and fixation obtained using different seed regions of the visual network averaged across runs and seeds, in the α BLP. Color scale reflects positive or negative modulations of Z score obtained from difference of correlation coefficients.
(B) Consistency maps across different nodes of the visual network. Regions in yellow-orange and in green-blue show consistent changes in correlation (positive or negative, respectively) across multiple nodes of the visual network. The map displays at least 6 of 10 nodes (more than half nodes), which show significant temporal correlations (Z score equal or greater than 4, p < 0.001 in each node). Color scale represents number of nodes with significant correlation at that voxel.

