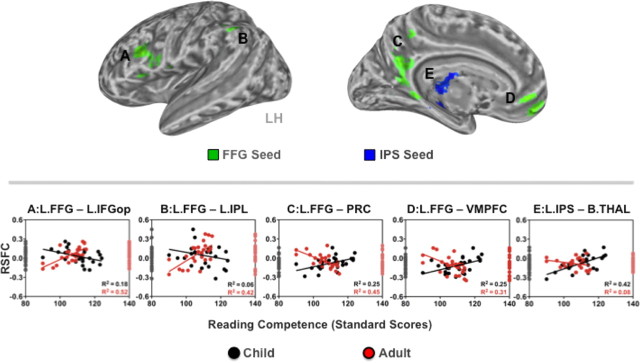
Figure 4.
Age-group divergent RSFC–reading competence relationships. The child and adult groups differed significantly in the relationships between reading competence (indexed by reading standard scores) and RSFC associated with the FFG (clusters in green) and IPS seeds (a cluster in blue). Voxelwise analyses were corrected for multiple comparisons (Z > 2.3, p < 0.05 corrected). The age-group differences are characterized by dissociations in the direction of the RSFC–behavior relationships. Scatter plots (A–E) depict RSFC–behavior (reading standard scores) relationships for each age group (children, black circles; adults, red circles). The distribution of RSFC strength for the child and adult groups is displayed on the left and right axes, respectively. L, Left; B, bilateral; IFGop, inferior frontal gyrus opercularis; IPL, inferior parietal lobule; PRC, precuneus; VMPFC, ventromedial prefrontal cortex; THAL, thalamus; LH, left hemisphere.

