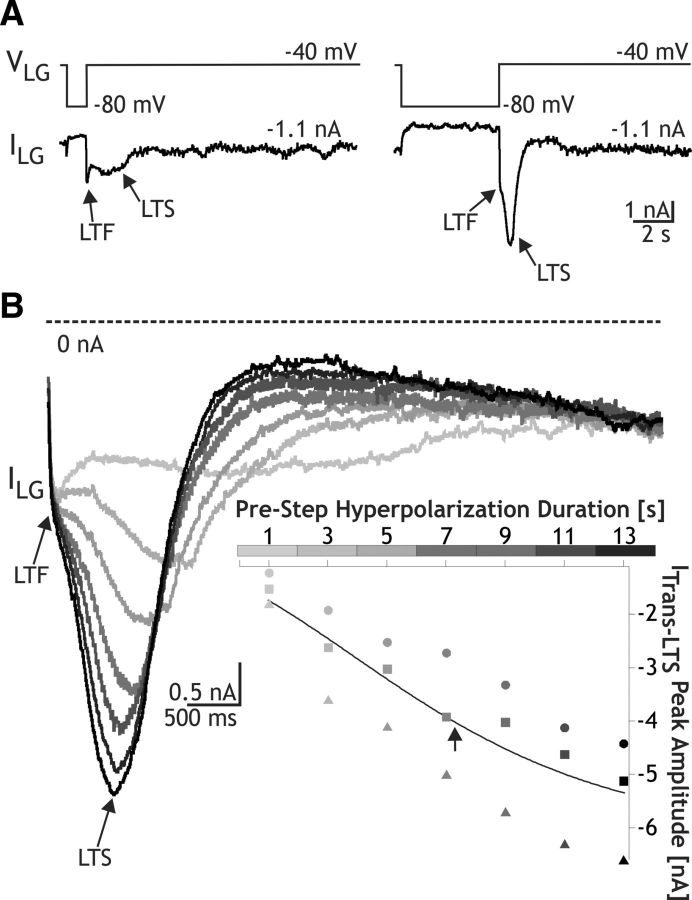
Figure 4.
CabPK-activated ITrans-LTS in the LG neuron exhibits a time-dependent deinactivation. A, Using TEVC, hyperpolarizing voltage steps to −80 mV were injected into the LG neuron for relatively brief (left) and long (right) durations, and then returned to −40 mV. A larger peak ITrans-LTS amplitude resulted upon the return to −40 mV after the longer duration hyperpolarization. In contrast, there was little change in the peak amplitude of ITrans-LTF for both step durations. B, Superimposed series of current responses in the LG neuron, aligned to the return to −40 mV after hyperpolarizing steps of different durations to −80 mV (see the gray scale, representing the different step durations, aligned with the x-axis of the inset scatter plot). Inset, Plot of ITrans-LTS peak amplitude as a function of hyperpolarizing step duration from three experiments. Each symbol represents a different experiment. The line represents the sigmoid fit to the data (Igor Pro), and the arrow represents the calculated midpoint.

