Figure 3.
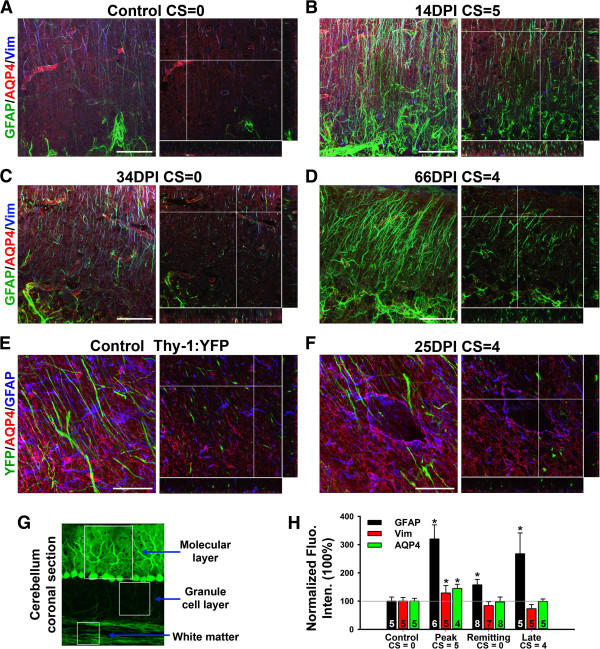
Differentially altered expression of astrocytic proteins in the cerebellum of EAE mice. A, The confocal image stack of cerebellar molecular layer that was stained for GFAP (green), AQP4 (red) and Vim (blue) from a control mouse. Collapsed 2D image is on the left and 3 cross sections of 3D are on the right. B, The images at the peak stage of an rrEAE mouse. C, The images at the remitting stage of an rrEAE mouse. D, The images at the relapsing stage of an rrEAE mouse. E, The confocal images of cerebellar WM from a Thy1-YFP transgenic mouse. YFP (green), AQP4 (red) and GFAP (blue). In (A-E), the crossbars are centered on astrocytic endfeet with colocalizing AQP4 and GFAP. F, The confocal images at the peak stage of chEAE. The crossbars show the lesion edge with upregulated AQP4 and GFAP. G, Structural diagram of cerebellar cortex. H, Summary of changes of protein levels during rrEAE in cerebellar molecular layer. One-Way ANOVA followed by Fisher’s test. *, significant difference from Control for each antibody, p < 0.05. The “n” number of quantified images is provided for each bar. Scale bars, 50 μm.

