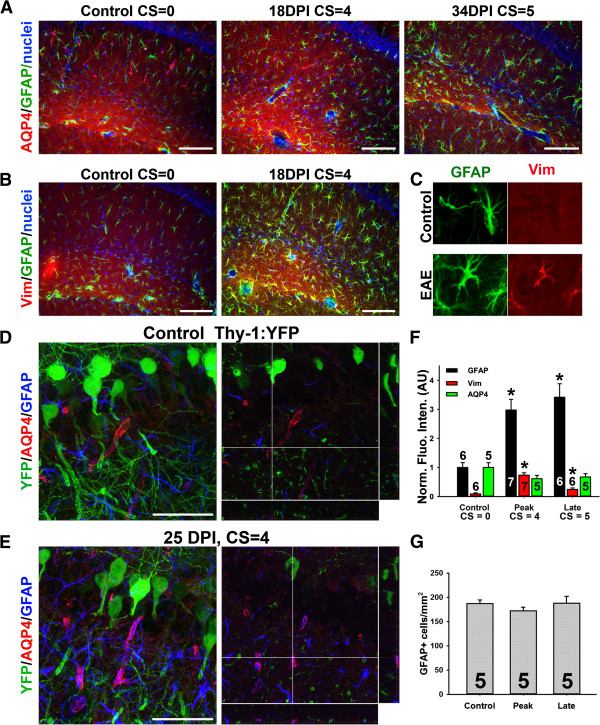
Figure 4.
Activation of astrocytes in the hippocampus of EAE mice. A, Increased GFAP but not AQP4 staining in the hippocampus of EAE mice. B, Increased Vim staining in the hippocampus during EAE progression. C, Enlarged images of individual astrocytes in the hippocampus clearly show the increase of Vim staining. High magnification confocal image stacks were obtained from control (D) and EAE (E) Thy1-YFP transgenic mice. Images contain YFP (green), GFAP (blue) and AQP4 (red). The collapsed 2D image is on the left, and 3 cross sections are on the right. The crossbars reveal astrocytic endfeet with colocalizing AQP4 and GFAP. F, Summary of the levels of astrocytic proteins at different stages during EAE progression. One-Way ANOVA followed by Fisher’s test, *, significant difference from Control for each antibody, p < 0.01. G, GFAP + cell number was not changed during EAE. The “n” number of quantified images is provided for each bar. Scale bars, 200 μm in A and B, 50 μm in D and E.

