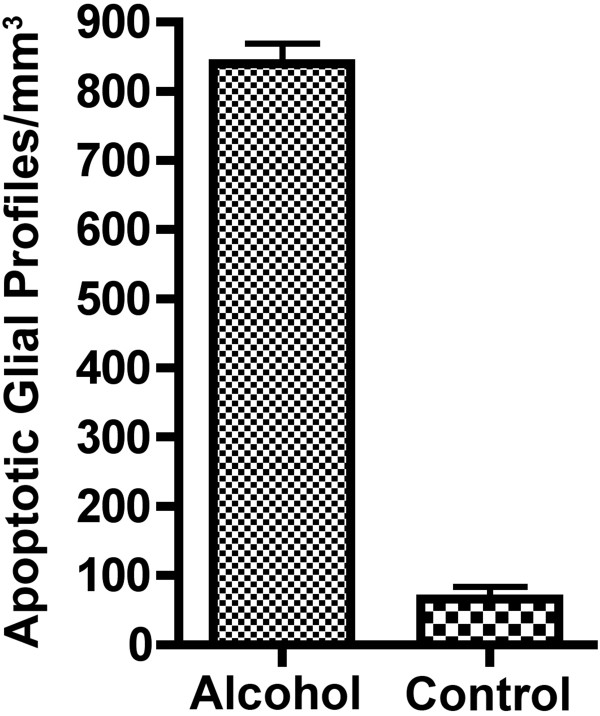
Figure 5.
Mean (± SEM) density of apoptotic OL profiles per mm3 of white matter in the brains of alcohol-exposed (n=5) versus control (n=4) fetal NHPs. To derive these mean density counts, the following four WM regions were sampled from each brain: the corona radiata, internal capsule, optic tract and cerebellar peduncle.

