
Figure 3.
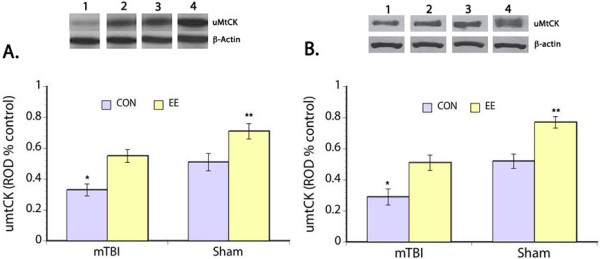
uMtCK Expression. Upper panel show representative Western blots of uMtCK expression in the prefrontal cortex (A) and hippocampus (B). Bar graphs show significantly decreased uMtCK expression in both prefrontal cortex and hippocampus of mTBI rats assigned to control housing. Housing rats in EE after mTBI restored uMtCK to normal levels. Remarkably, an overall increase in uMtCK is evident in the sham animals housed in EE. *p < 0.05, **p < 0.01. Legend: 1 – mTBI control housing, 2 – mTBI EE housing, 3 – sham control housing, and 4 – sham EE housing.