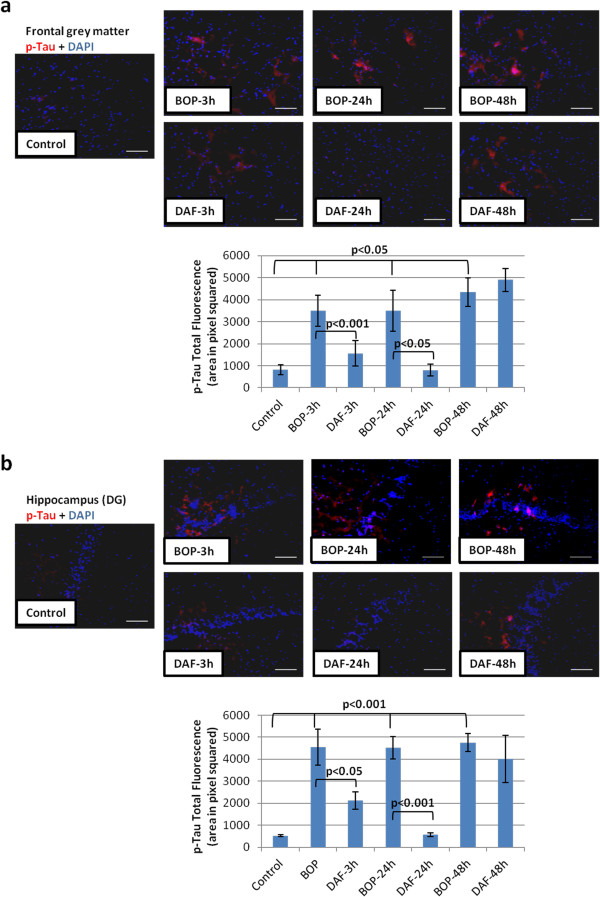
Figure 8.
DAF treatment decreases tau phosphorylation in animal brain tissue after BOP exposure. Representative photomicrographs of frozen brain sections stained with anti-p-tau antibody (top) and the total fluorescence of p-tau (bottom). Frontal grey matter (a) and hippocampus (DG) (b). Original magnification of × 200. Scale bar, 200 μm. Group data is expressed as mean ± SEM and compared using one-way ANOVA followed by Bonferroni test. n = 8 for control, 3 and 24 h experimental groups. n = 5 for 48 h experimental groups.

