
Fig. 3.
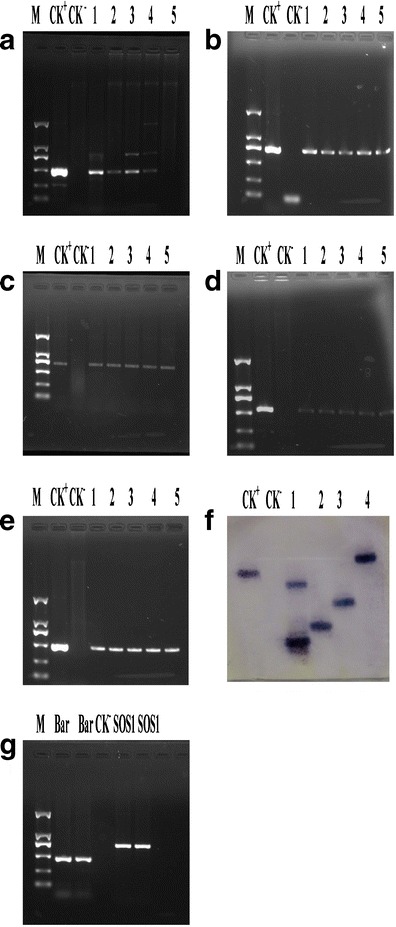
Molecular analysis of wild-type and transgenic lines of tall fescue. a PCR amplification of 463 bp Bar gene. M, DL2000 marker, CK+, plasmid, CK−, wild-type, lanes 1,2,3, and 4 represent PCR amplicon from line 6-2, 6-3, 6-4, 6-5, and 6-6, respectively. b PCR amplification of 700 bp SOS1 gene. c PCR amplification of 550 bp SOS2 gene. d PCR amplification of 683 bp SOS3 gene. e PCR amplification of 460 bp CBL10 gene. f Analysis of transgenic tall fescue plants (lanes 1–6) by southern blot hybridization after digesting genomic. DNA with EcoI and probing with labeled Bar. M molecular marker, W wild-type plant. g RT-PCR analysis of Bar and SOS1 transcripts in transgenic plants. M, DL2000 marker, lanes 1 and 2 represent Bar amplicon from lines 6-2 and 6-3. Lane 3 represents Bar amplicon from WT. Lanes 4 and 5 represent SOS1 PCR amplicons from lines 6-2 and 6-3, respectively