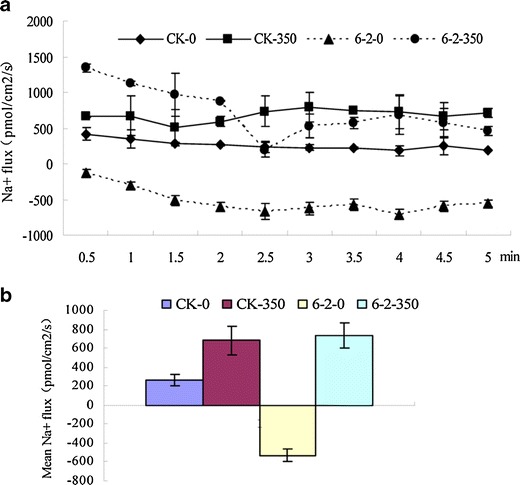
Fig. 8.

Effect of salinity (350 mM NaCl) on net Na+ flux (influx negative) measured in roots of transgenic lines (6-2) and wild-type (WT) plants. CK-0 WT plants without treatment, CK-350 WT plants with 350 mmol NaCl treatment, 6-2-0 transgenic lines 6-2 without treatment, 6-2-350 transgenic plants with 350 mmol NaCl treatment. a Na+ flux for WT and transgenic plants roots. b The mean rate of Na+ flux during the period of salt-stress treatment
