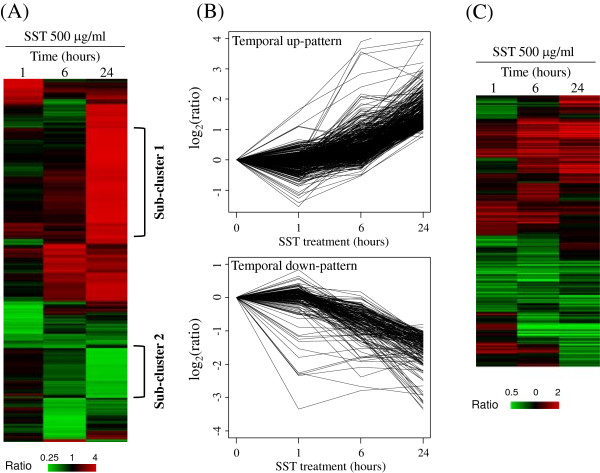
Figure 2.
Temporal expression of genes and microRNAs after SST treatment in primary mouse hepatocytes. (A) Approximately 1100 differentially expressed genes with a fold ratio greater than 2 or less than 0.5 for at least one sample are clustered hierarchically. Sub-cluster 1 and Sub-cluster 2 indicate the two sub-clusters. Columns represent individual samples and rows represent individual genes. The expression ratio is represented in colors from red (i.e., high) to green (i.e., low), as indicated by the scale bar. (B) Temporally altered genes were identified by the Short Time-series Expression Miner (STEM) analysis and classified in two patterns (false discovery rate [FDR] less than 0.001). The temporal up-pattern comprises 463 genes and the temporal down-pattern comprises 177 genes. (C) Approximately 540 microRNAs with a minimum fold ratio of 1.5 in at least one sample are clustered hierarchically.

