
Figure 3.
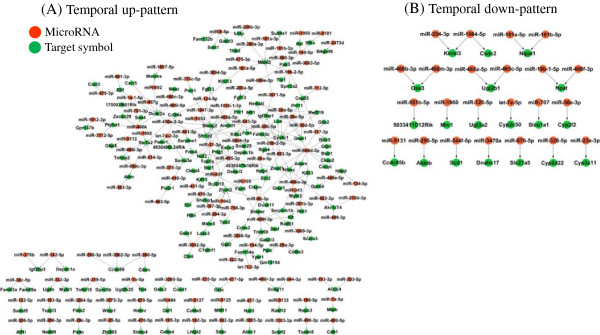
The connection map between microRNAs and target genes altered by SST. Genes showing a negative correlation with microRNA expression were selected as microRNA targets by implementing permutation-based correlation method (i.e., FDR less than 0.01). The green nodes represent the 174 target genes. Of these, (A) 155 genes were selected from temporal up-pattern and (B) 19 genes were selected from the temporal down-pattern. The red nodes represent microRNAs, of which 127 microRNAs are associated with (A) the temporal up-pattern genes and 23 microRNAs are associated with (B) temporal down-pattern genes.