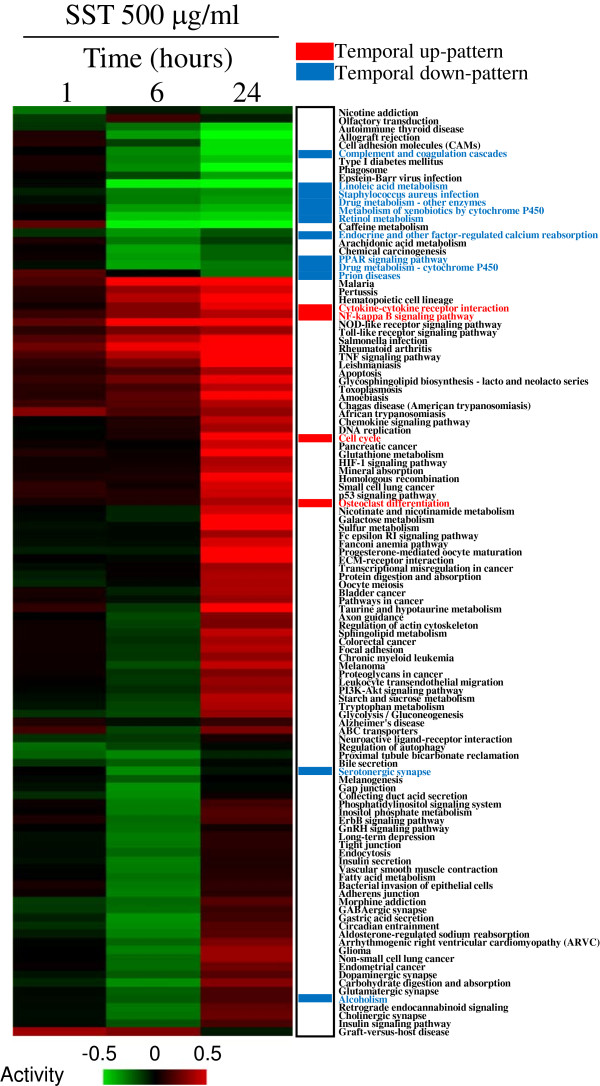
Figure 4.
Pathway activities altered by SST in primary mouse hepatocytes. The temporal change of pathway activity is measured by linearly combining the logarithmic expression value of all genes in each pathway and then clustering them hierarchically. The columns represent individual samples and the rows represent the activity of the pathways. Red indicates high activity and green indicates low activity, as indicated by a scale bar with arbitrary units. The pathways selected as significant in enrichment analysis are indicated in red for temporal up-pattern and blue for temporal down-pattern.

