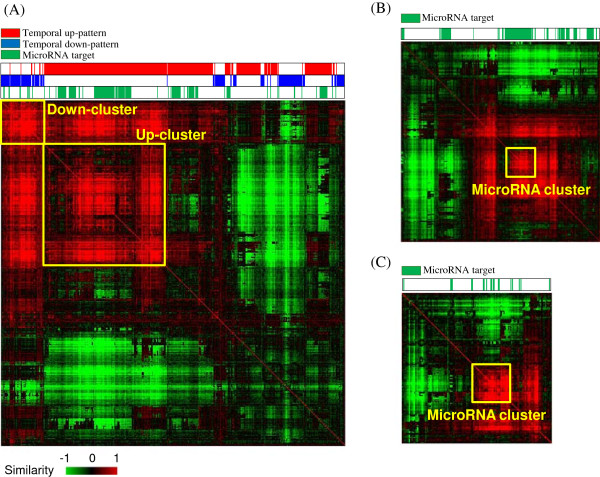
Figure 6.
The clustering profile of temporally co-expressed genes by SST, based on the similarity of the transcription factor binding site (TFBS). Genes each from (A) both temporal up- and down-patterns, (B) from the temporal up-pattern, and (C) from the temporal down-pattern were clustered hierarchically, based on the similarity of TFBS structure in the promoter region (-2000 to +500 bp from the transcription start site). The positions of the temporal up-pattern genes and the down-pattern genes in (A) are highlighted in upper bar with red and blue colors, respectively. The positions of microRNA target genes are also indicated in green. The level of similarity is represented in colors from red (i.e., high) to green (i.e., low), as indicated by the scale bar with arbitrary units. The tightly clustered subgroups are colored in yellow boxes (Down-cluster and Up-cluster in (A) and MicroRNA cluster in (B) and (C)).

