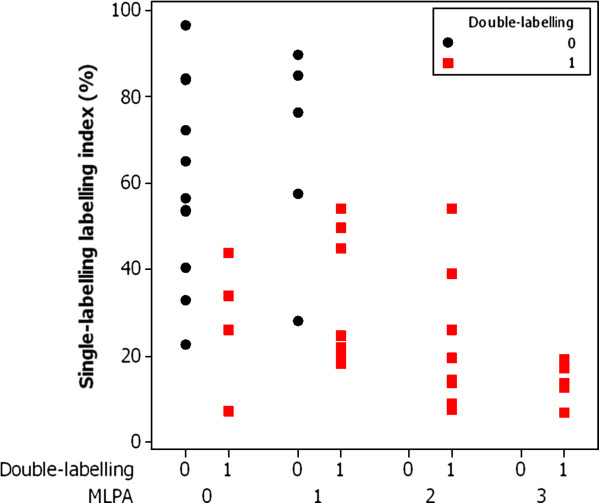
Figure 2.
Chart of MGMT single-labelling, MGMT double-labelling and MLPA status. The chart shows the labelling index for MGMT from the single-labelled slides on the Y-axis for the 40 cases plotted against the results of double-labelling and MLPA status. The 4 cases that were false-positive by double-labelling are seen in the second column from the left. All of these cases have a labelling index of less than 50% by single-labelling suggestive of a methylated status. The results of double-labelling and single-labelling are therefore concordant and combined analysis would not have avoided calling these cases (falsely) positive. The 5 cases that were false-negative by double-labelling are seen in the third column from the left. Of these, 4 have a labelling index of greater than 50% by single-labelling suggestive of an unmethylated status. The results of double-labelling and single-labelling of these 4 cases are therefore concordant and combined analysis would not have avoided calling these (falsely) negative. Only one of the 5 false-negative cases has a labelling index of less than 50% by single-labelling suggestive of a methylated status. In this case the labelling index might have been helpful in avoiding calling this (falsely) negative on double-labelling. Overall however the extra effort involved in measuring the labelling index by automated quantitative image analysis on the single-labelled slides may not be worthwhile, particularly in labs not set up for image analysis.

