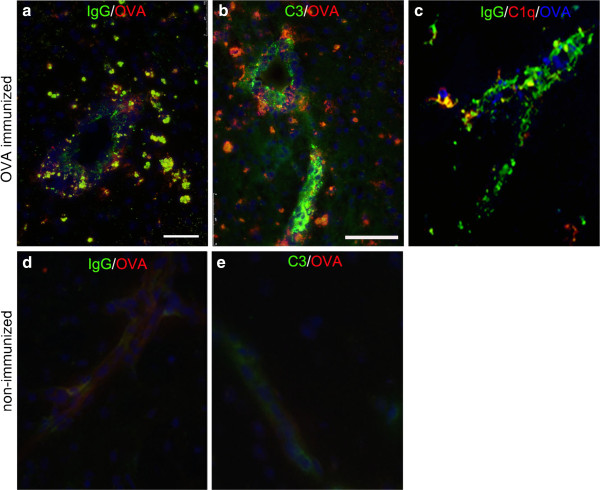
Figure 3.
Immune complexes. Immune complex formation was analyzed at 24 h after intracerebral OVA injection and stained for: a and d) IgG(green) and OVA (red), b and e) C3 (green) and OVA (red) and c) IgG (green), C1q (red) and OVA (blue). Co-localization is shown in yellow. Representative of n=3. Scale bar =75 am.

