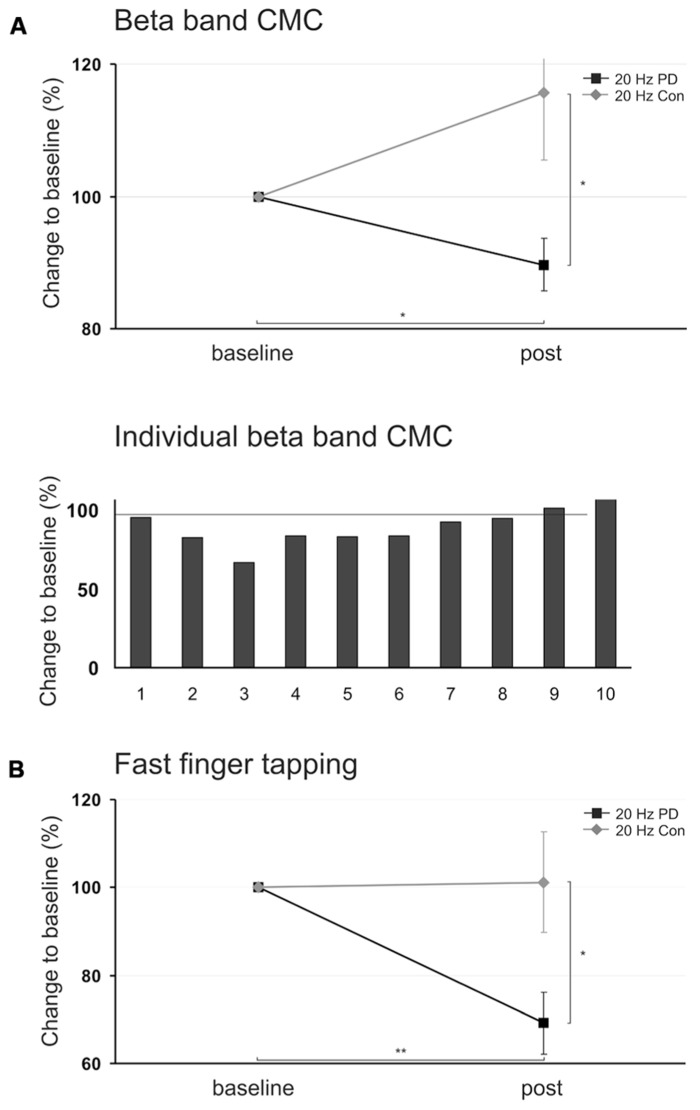
FIGURE 4.
(A) Upper panel: Mean relative changes of beta band cortico-muscular coupling (CMC) amplitude during isometric contraction in PD patients and healthy control subjects following 20 Hz tACS (mean ± SEM), lower panel: Individual relative changes of beta band CMC amplitude in 10 PD patients following 20 Hz tACS. (B) Relative changes of amplitude variation during fast finger tapping following 20 Hz tACS in PD patients and healthy control subjects. Patients performed the tasks with the more severely affected forearm, control subjects were matched, respectively. Asterisk indicates p < 0.05, two asterisks indicate p < 0.01.

