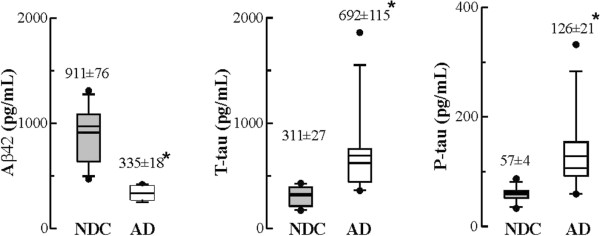
Figure 6.

Levels of classical AD biomarkers in lumbar CSF. Box plot of CSF levels of Aβ42, T-tau and P-tau for the 12 probable AD cases (open circles) and the 12 NDC controls (closed circles). Means ± SEM are shown. Mann-Whitney U test, *p < 0.05, **p < 0.01.
