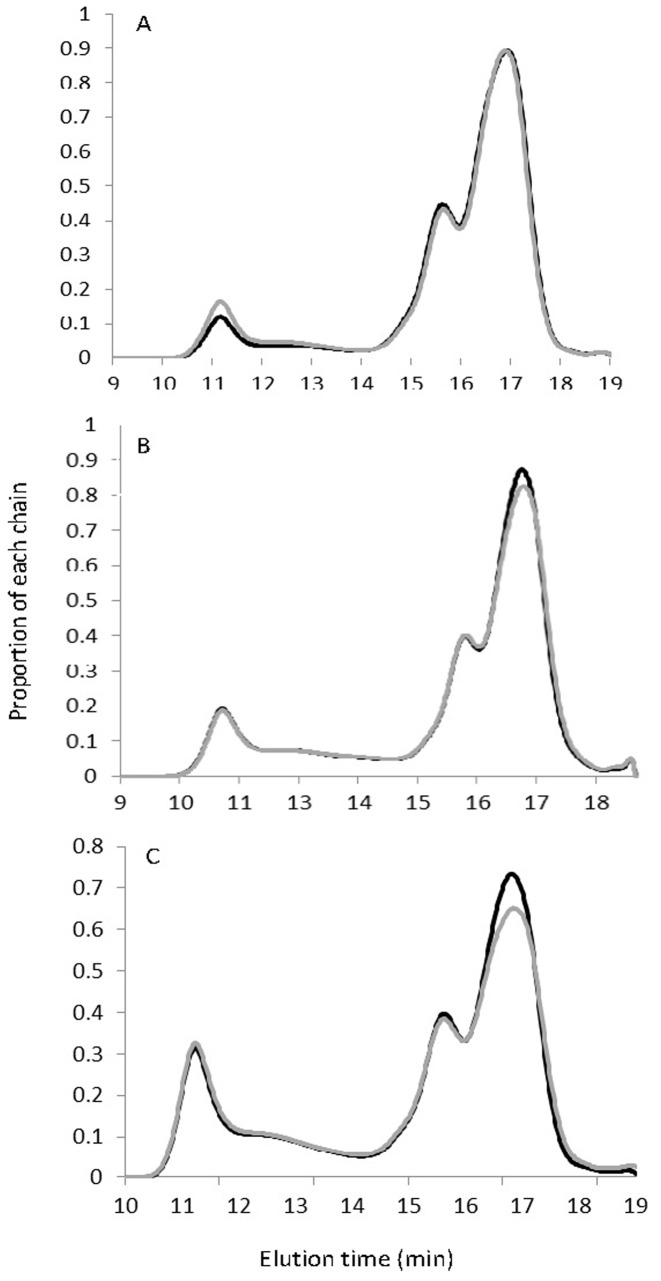
Figure 4. Size exclusion chromatograms of low (A), intermediate (B) and high (C) amylose varieties.
Each curve is the average of ten different rice varieties from each end of the range in each class. In each class, those with high amylose are shown by the grey curves, and those with lower amylose are shown by the black curve. Chains of amylose elute before 14 min and amylopectin chains after 14 min.

