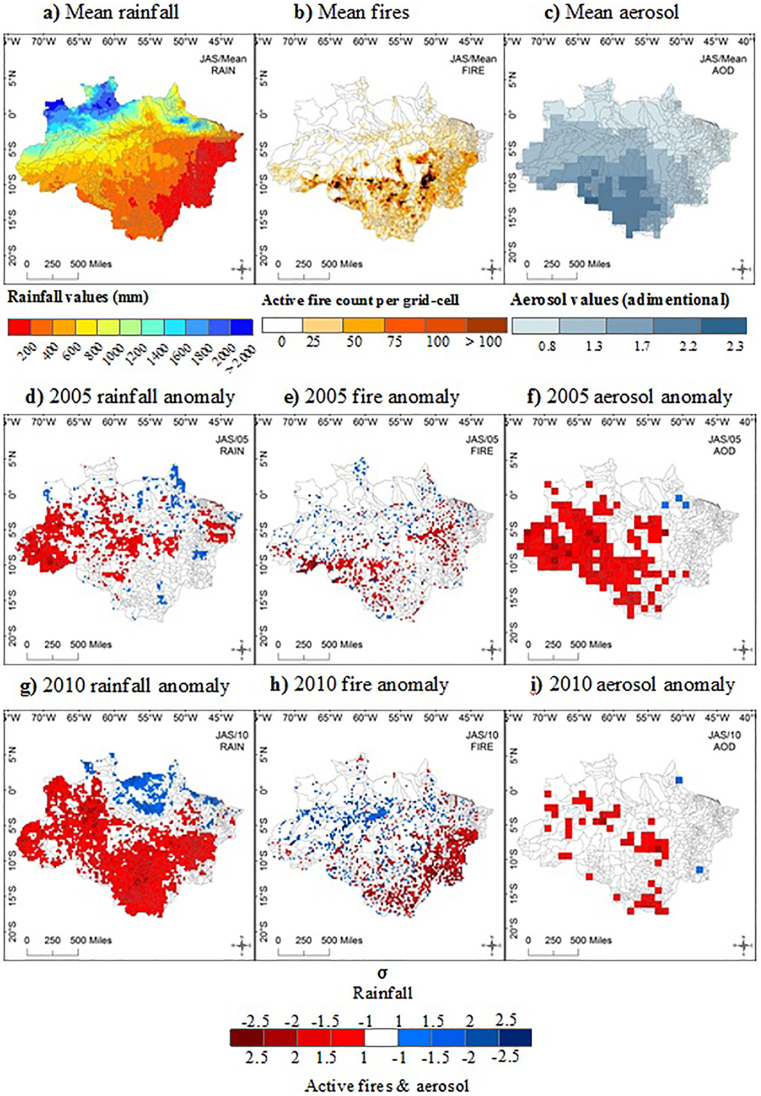
Figure 1. Standardised JAS anomalies as a departure from the 2001–2010 mean.
(a) mean rainfall values (mm) (2001–2010), (b) mean active fire count (2001–2010), (c) mean aerosol levels (2001–2010), (d) standardised rainfall anomalies for 2005, (e) standardised active fire anomalies for 2005, (f) standardised aerosol anomalies for 2005, (g) standardised rainfall anomalies 2010, (h) standardised active fire anomalies 2010, (i) standardised aerosol anomalies for 2010. The anomalies are normalised by the standard deviation of the time-series (2001–2010) for each grid-cell. Anomalies were generated using ENVI 4.8 and ArcGIS 10.

