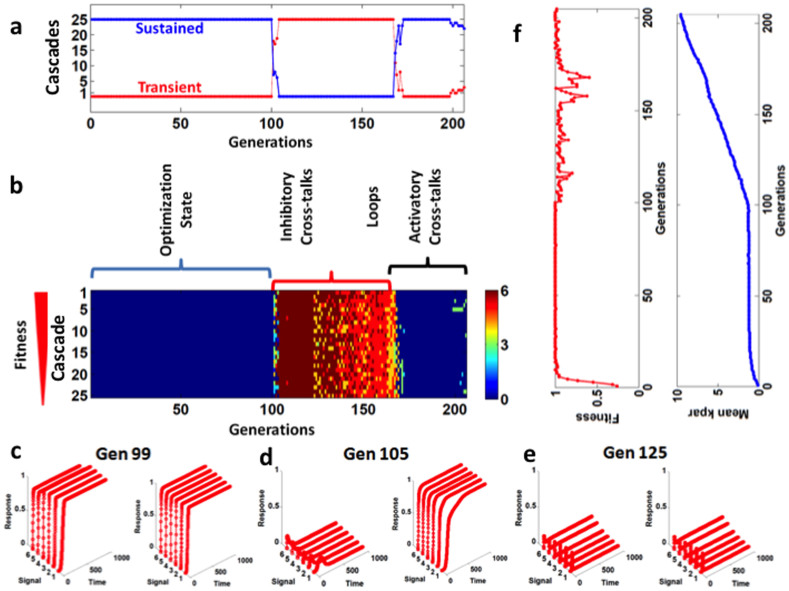
Figure 4. Change in response kinetics of the signaling cascade from simple cascade (without FFL, FBL, and cross-talk) to complex cascade (with FFL, FBL, and cross-talks).
(a) Total number signaling cascades with transient and sustained response among the best 25 signaling cascades. (b) As in our model for each cascade we have six input signals (of different strength) so we have six output response. Here, we show total number of response (transient and/or sustained) in each cascade. (c), (d), and (e) show the kinetics of the output response (cascade 1 (left side figure) and cascade 2 (right side figure)) in generation 99, 105, and 125, respectively. (f) Mean fitness (left side) and the mean of kpar (right side) of cascades (best cascades).

