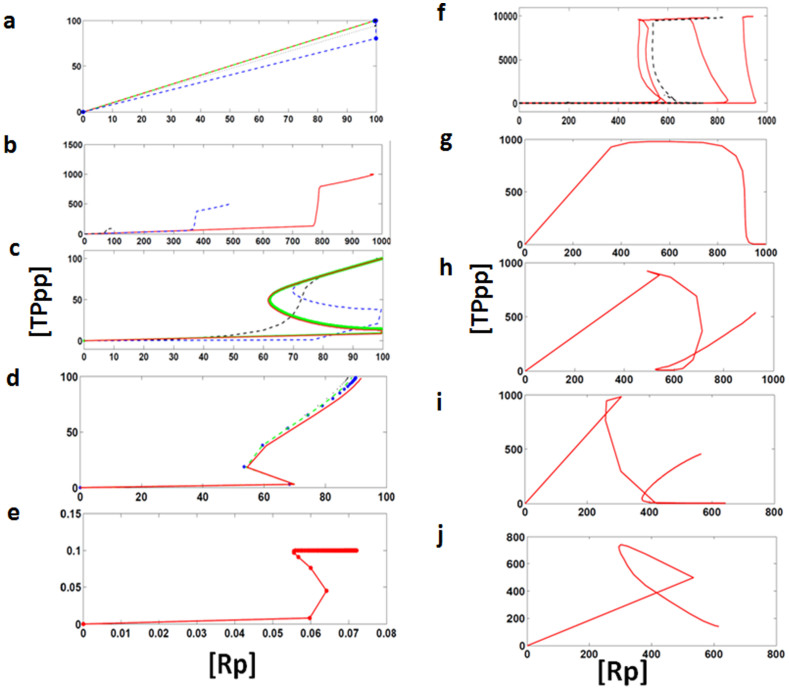
Figure 5. Dose-response curve.
x-axis represents total concentration of activated receptor ([Rp]) and y-axis represents total concentration of output response ([TPpp]). (a) Red, blue, and black curves are representing dose-response curve for three different sets of kinetic parameters. (b) For one fixed set of kinetic parameters (randomly selected from the evolved cascades), the total output response have been plotted for three different concentration of R and TP. Red, blue, and black curves are representing dose-response curve for three different concentration of R and TP is 1000 μl, 500 μl, and 100 μl, respectively (positive FBL). (c) signal-response curve in the presence of a positive FBL and (d) signal-response curve in the presence of a negative FBL. Black curve represents the dose-response curve plotted for a set of kinetic parameter (one of the evolved cascade randomly selected) then we increase the kinetic parameter values which are involved in positive FBL blue curve (kpar updated with the values between 10 and 100), green curve when positive FBL kpar is between 100 and 500), and red curve where the positive FBL kpar is between 500 and 1000. (e) Signal-response curve in the presence of a FFL and a FBL, (f) signal-response curve in the presence of a negative FFL and a negative FBL. (g), (h), and (i) are the signal-response curve in the presence of inhibitory cross-interactions between the cascades and (j) signal-reponse curve in the presence of activation links between the two cascades.

